Traders talk about discipline as a trait: some have it and some do not. That framing is not much use, because a trait cannot be improved on a Tuesday. Discipline measured as behaviour can. It becomes a number, you can see it move, and you can price what it costs when it slips. This post shows how to measure it from a journal, what to compare it with, and the ways the number can mislead.
Define it as plan adherence
The simplest workable definition: discipline is the share of your trades on which you did what your written plan says. That needs two things. A plan with rules specific enough to be judged yes or no, and a mark after each trade saying whether it followed them.
"Be patient" cannot be marked. "No entry within ten minutes of a loss" can. "Manage risk" cannot; "risk 1% of the account per trade and set the stop before entry" can. So the first step in measuring discipline is to rewrite the vague rules into checkable ones. A list of three to six is plenty to start.
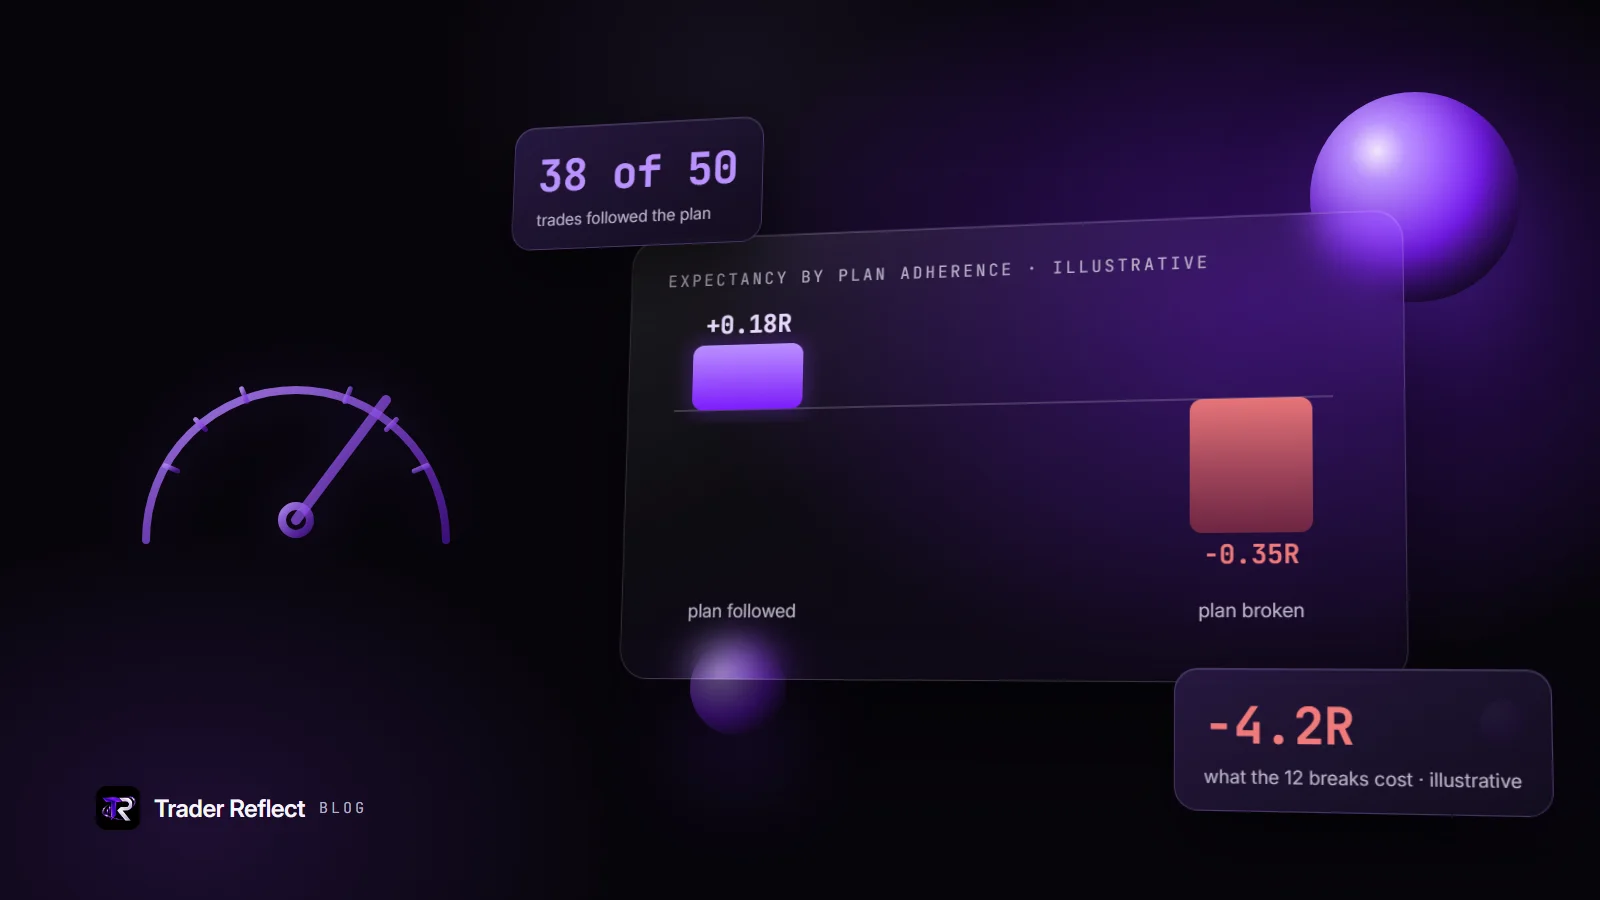
Then mark each trade. Did it meet all the rules? Yes or no. If it broke any, note which. The discipline score is the number of yes marks divided by the number of marked trades. Followed on 38 of 50 trades is 76%.
Mark honestly and immediately
The score is only as honest as the marks. Three habits help.
- Mark straight after the trade, before you know whether it won. Outcome colours memory. A winner that broke a rule gets forgiven; a loser that followed the rules gets blamed.
- Mark the rule, not the result. A trade that followed every rule and lost is a yes.
- Mark the breach even if it helped. A rule broken that happened to work is still a break. This is the hardest and most important entry.
Leave trades unmarked rather than guessing. A score built on marks you invented later is worse than none.
Put a price on it
A discipline score on its own is a number with no consequence. The useful step is to split your results by it and compare the average result in R.
Suppose, as an illustration, 50 marked trades. In 38 you followed the plan and averaged +0.18R. In 12 you broke it and averaged −0.35R. Together that is 38 × 0.18 plus 12 × −0.35, or +2.64R over 50 trades, about +0.05R per trade. Without the 12 rule-breaking trades the same period would have returned 6.84R. The rule breaks cost roughly 4.2R, and wiped out about three fifths of what the followed trades earned. That is an illustration, not data about anyone, but it shows the shape of the argument: the price of the breaks is a number, and a number is easier to act on than a feeling.
If instead the broken-plan trades averaged the same as the rest, the finding is different and equally useful: the rules you are breaking may not matter, or the plan may be wrong. Either way you learn something.
Break the score down by rule
A single percentage hides which rule fails. Keep a count per rule: how many times each was broken, and the total R of the trades that broke it. Two lists emerge, the most frequent breaks and the costliest breaks, and they often differ. A rule you break rarely but at large cost, such as moving a stop, can matter more than one you break often at little cost.
Then look for the circumstances. Do breaks cluster after losses, after wins, late in the session, on certain feeling words, on days of short sleep? That is where the next if-then rule comes from. The post on if-then plans for traders covers how to write one, and how to stop revenge trading is a worked example for one of the most common breaks.
Track the trend, with caution
Compute the score weekly and compare it with the previous few weeks. A rising adherence rate while you work on one rule is a sign the rule is working. But weekly samples are small, and a swing of a few points from one week to the next may be noise. With twenty trades in a week, one extra rule break moves the score five points. Look at a rolling window of the last fifty or hundred trades, and compare windows rather than single weeks.
Do not turn the score into a target to hit at any cost. If you find yourself marking trades "followed" to keep the figure up, the number has stopped measuring anything. Equally, if the plan is so strict that no trader could follow it, a low score is a message about the plan.
What the score does not tell you
- Whether the plan is any good. You can follow a bad plan perfectly. Discipline is necessary for an edge to show, not proof that you have one. Check the expectancy of the followed trades.
- Whether you are in the right state. A trader can follow every rule while exhausted and still trade poorly.
- Why you break rules. The score says how often. The reasons come from the entries around it, such as the feeling words and timing.
- Anything about a small sample. Ten marked trades cannot support a conclusion. The glossary entry on sample size explains how quickly averages move with few trades.
A simple routine
- Write three to six checkable rules.
- After every trade, mark followed or not, and which rule if not.
- Weekly, compute the rate and the average R of followed against not-followed trades.
- Pick the costliest broken rule and write one if-then plan for it.
- Next week, check how many times the cue came up and how often you kept the plan.
- Monthly, review whether the rules themselves still make sense.
Where Trader Reflect fits
Trader Reflect scores discipline in this way: as the share of marked trades on which the plan was followed, and it weights that figure most heavily in your overall profile. If the trades have no plan marks it says nothing, rather than guessing a score. It shows the count behind the number, and turns your costliest pattern into an if-then plan it later checks. You can open Trader Reflect from your Money Circle Journal and see what membership includes. For the arithmetic of pricing a habit in R, see why your win rate lies, and ChartViews' guide to position sizing with fixed percentage risk helps you write the sizing rule so that it is checkable. The glossary has short entries on the discipline score and on the trading plan.
Educational content, not financial advice. Trading involves risk of loss.