Win rate is the first number most traders learn and the one they trust most. It is also the one most likely to mislead them. A high win rate feels like skill and a low one feels like failure, but the figure says nothing about how big the wins and losses were. The number that does is expectancy, measured in R. This post shows, with arithmetic you can check, how the two can point in opposite directions and what to track instead.
What each number measures
Win rate is winning trades divided by all trades. Thirty winners in fifty trades is 60%.
R is a unit of risk. 1R is the amount you risked at your initial stop, so a trade that makes twice what you risked is +2R and a full stop-out is −1R. Measuring in R makes results comparable across account sizes and instruments.
Expectancy is the average result per trade in R:
Expectancy = win rate × average win − loss rate × average loss
Both averages are in R, and the loss rate is one minus the win rate. If you want the longer treatment, the post on expectancy in R works through ten trades.
Two traders
Take two traders, with illustrative numbers.
Trader A wins 70% of trades. The average win is 0.4R and the average loss is 1.2R.
- 0.7 × 0.4 = 0.28
- 0.3 × 1.2 = 0.36
- Expectancy = 0.28 − 0.36 = −0.08R per trade
Trader B wins only 35% of trades. The average win is 2.4R and the average loss is 1R.
- 0.35 × 2.4 = 0.84
- 0.65 × 1.0 = 0.65
- Expectancy = 0.84 − 0.65 = +0.19R per trade
Trader A is right seven times in ten and loses money on average. Trader B is wrong nearly two times in three and makes money. Over 100 trades, A is down about 8R, and B is up about 19R. The win rate pointed the wrong way.
These figures are chosen to show the mechanism, not to describe typical traders. But the mechanism is real: every method trades win rate against payoff, and only the combination tells you anything.
Why a high win rate is easy to get and not worth much
Win rate rises with behaviour that hurts you. Exit winners early and more of them close green. Hold losers in the hope they come back and fewer of them close red, until one does not. Both raise the win rate while shrinking the average win and growing the average loss.
This is the disposition effect that Shefrin and Statman described in 1985: selling winners too soon and holding losers too long. It can leave a win rate that looks healthy and an expectancy that is falling. The glossary entry on loss aversion covers the psychology. The practical point is that a win rate that suddenly improves is not good news until you have checked the average win and average loss next to it.
Why a low win rate is hard to live with
The reverse trap is real too. A method with a low win rate and large winners is perfectly workable on paper, but it means long losing runs. At a 35% win rate, the chance of five losses in a row from any given trade is 0.65 to the fifth power, about 12%. Over a couple of hundred trades, runs like that are routine. Many people abandon such a method during an ordinary bad run, just before the winners arrive. Knowing the run lengths your numbers produce, in advance, is part of being able to follow the plan. See the entry on variance for more.
What to track instead
Put these side by side every time you look at a record:
- Win rate, because it describes what the experience will feel like.
- Average win and average loss in R, because they describe the payoff.
- Expectancy in R, because it combines the two into one number.
- The number of trades, because every figure above is an estimate from a sample.
If the win rate moves, check whether the average win or loss moved with it. If you changed how you exit, expect all three to move, and judge the change by expectancy.
Break expectancy down
Your overall expectancy is an average over very different trades. Splitting it shows where the money is made and lost. Useful cuts:
- By setup, if you tag them.
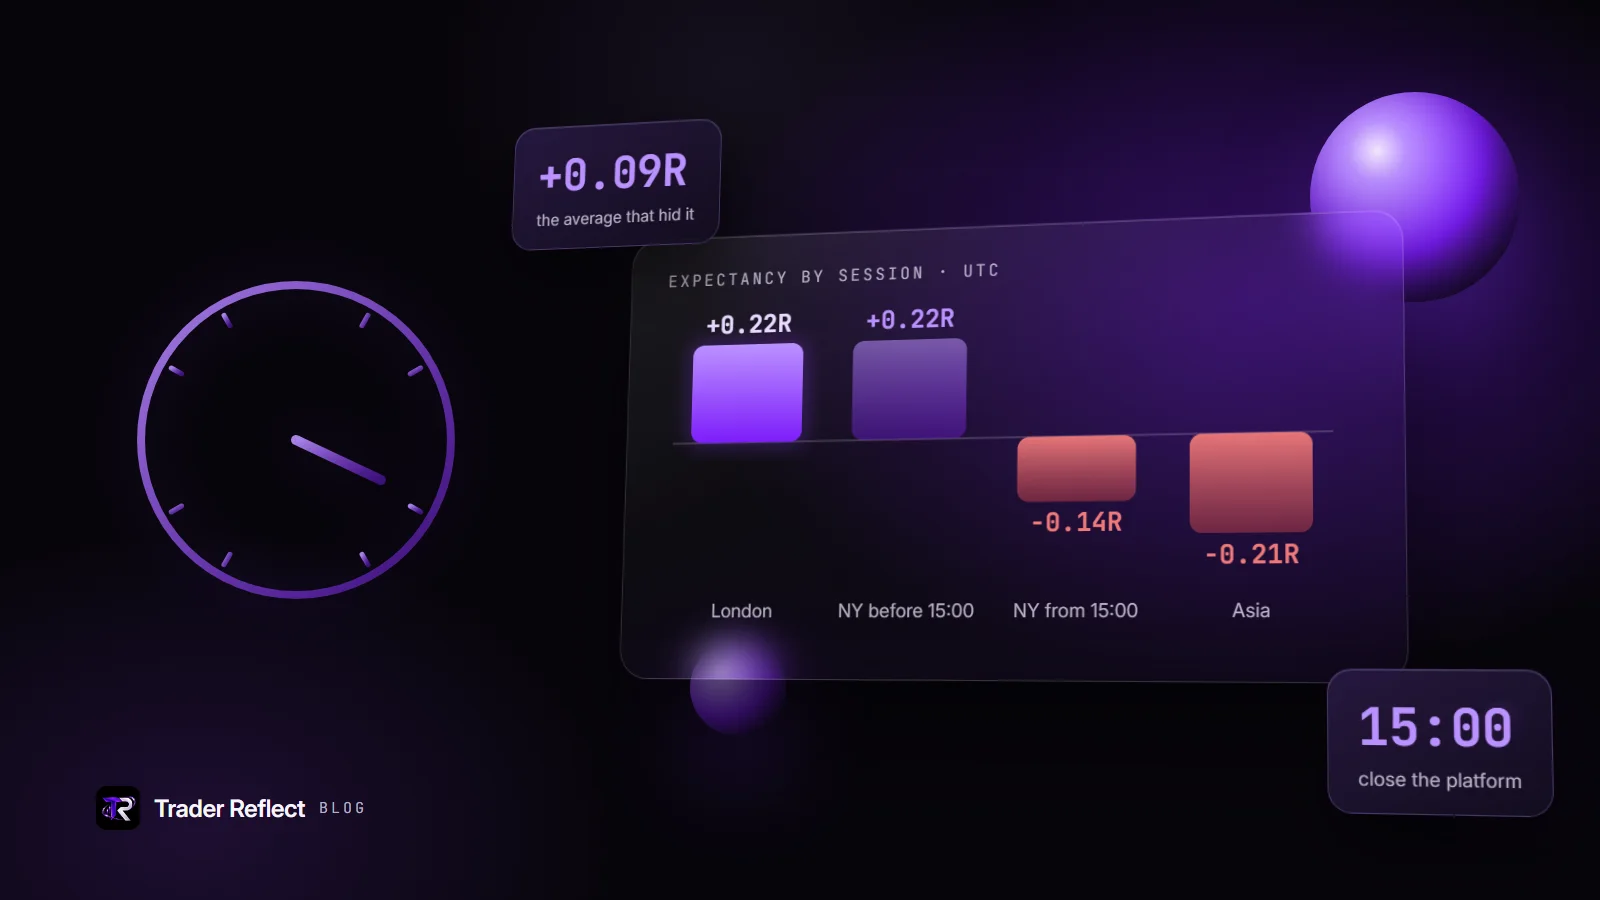
- By hour or session.
- By minutes since the last loss.
- By risk taken, for example the trades after two wins against the rest.
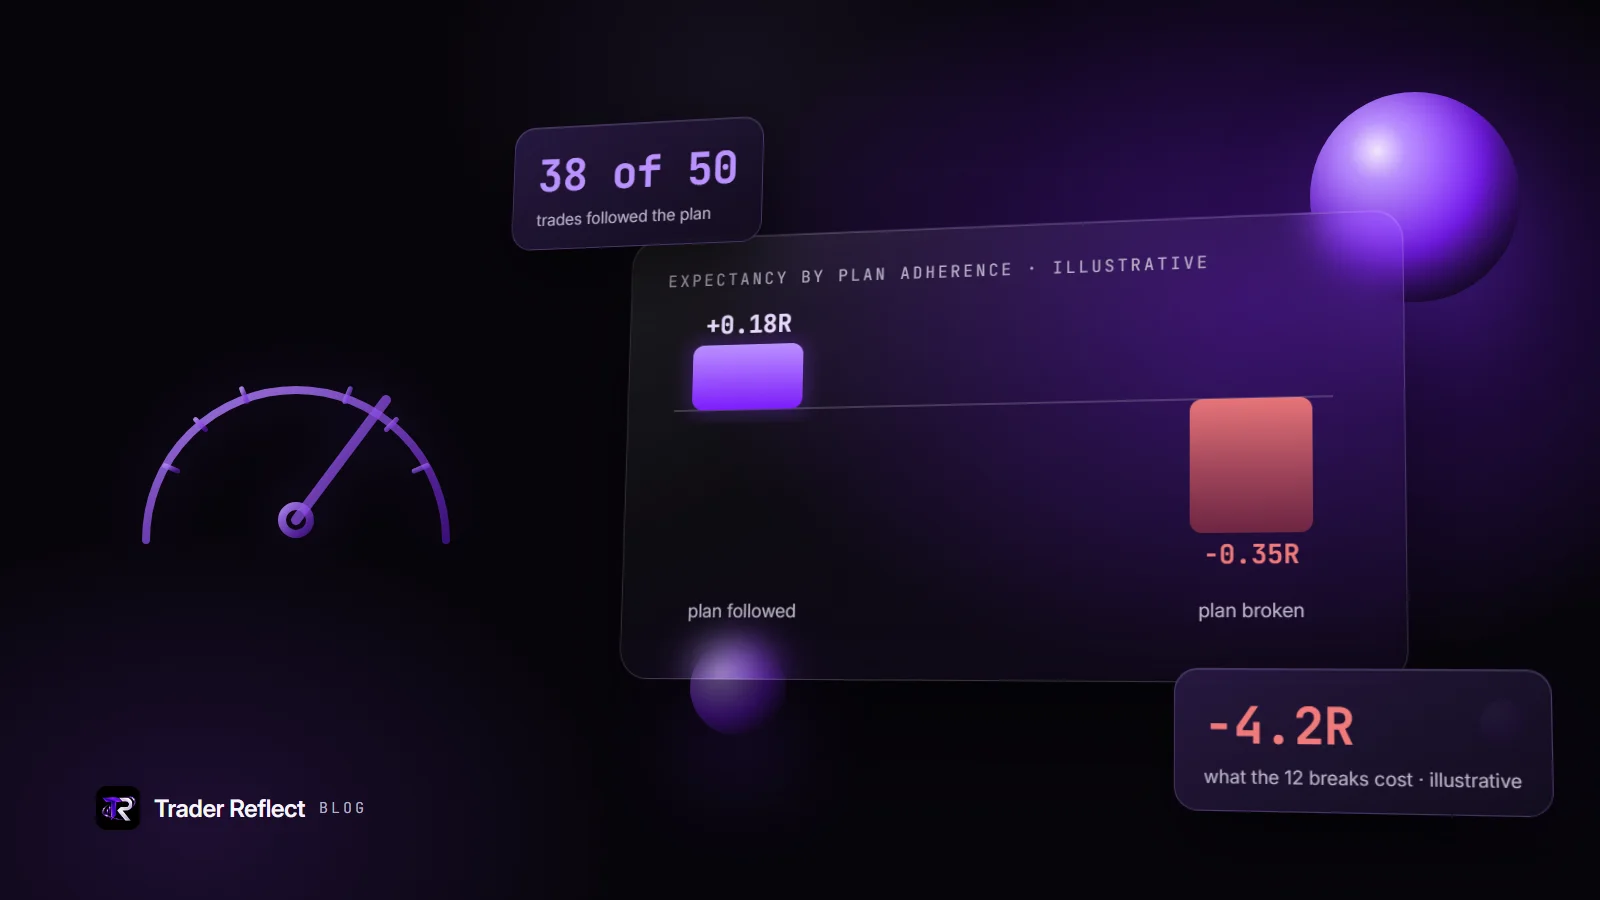
- By plan followed or not.
- By the feeling word you logged.
A small positive overall number often hides one group that earns well and another that loses steadily. That is the usual story behind a flat account despite a sound method. Why traders size up after a winning streak is one such example, and when your edge fades is another.
The limits of expectancy
- It is an estimate. With few trades it is noisy. If your results spread around 1R, the average of 100 trades is uncertain by roughly 0.1R either way, so a small positive figure is not clearly different from zero. Each cut also has fewer trades than the whole. See sample size.
- It needs a defined risk. R is only honest if the initial stop was set before entry.
- It hides money. A −1R loss at double size is still −1R but costs twice as much. Read R beside the risk actually taken.
- It says nothing about drawdowns. A positive expectancy can still come with a deep drawdown if the size is too large. See position sizing.
- It assumes the future resembles the past, which markets do not guarantee.
A short routine
- Log every trade with its result in R and the risk taken.
- Each week, compute win rate, average win, average loss and expectancy for the last fifty or hundred trades.
- Compare with the previous window, not with last week alone.
- Cut by one or two variables chosen in advance, and note the trade count in each group.
- Pick the cut that costs the most and write one rule for it.
Where Trader Reflect fits
Trader Reflect computes expectancy and drawdown from your results in R, by hour and session, and looks in your Money Circle journal for the costly habits above, printing the number of trades behind each finding and capping its confidence. You can open Trader Reflect from your Money Circle Journal, and see what membership includes. To set up the R unit itself, ChartViews has a clear piece on risk-reward ratio with worked examples. The glossary has short entries on win rate, expectancy and the R-multiple.
Educational content, not financial advice. Trading involves risk of loss.