Most traders who keep a journal know their overall result. Fewer know whether that result holds across the day. It is common for expectancy to sag at certain hours, or in a session that does not suit the way you trade, and an overall average can hide that completely. This post shows how to split your own record by hour and by session, how to read the numbers without fooling yourself, and how to turn a real finding into one rule tied to the clock.
Why an overall average can hide a weak hour
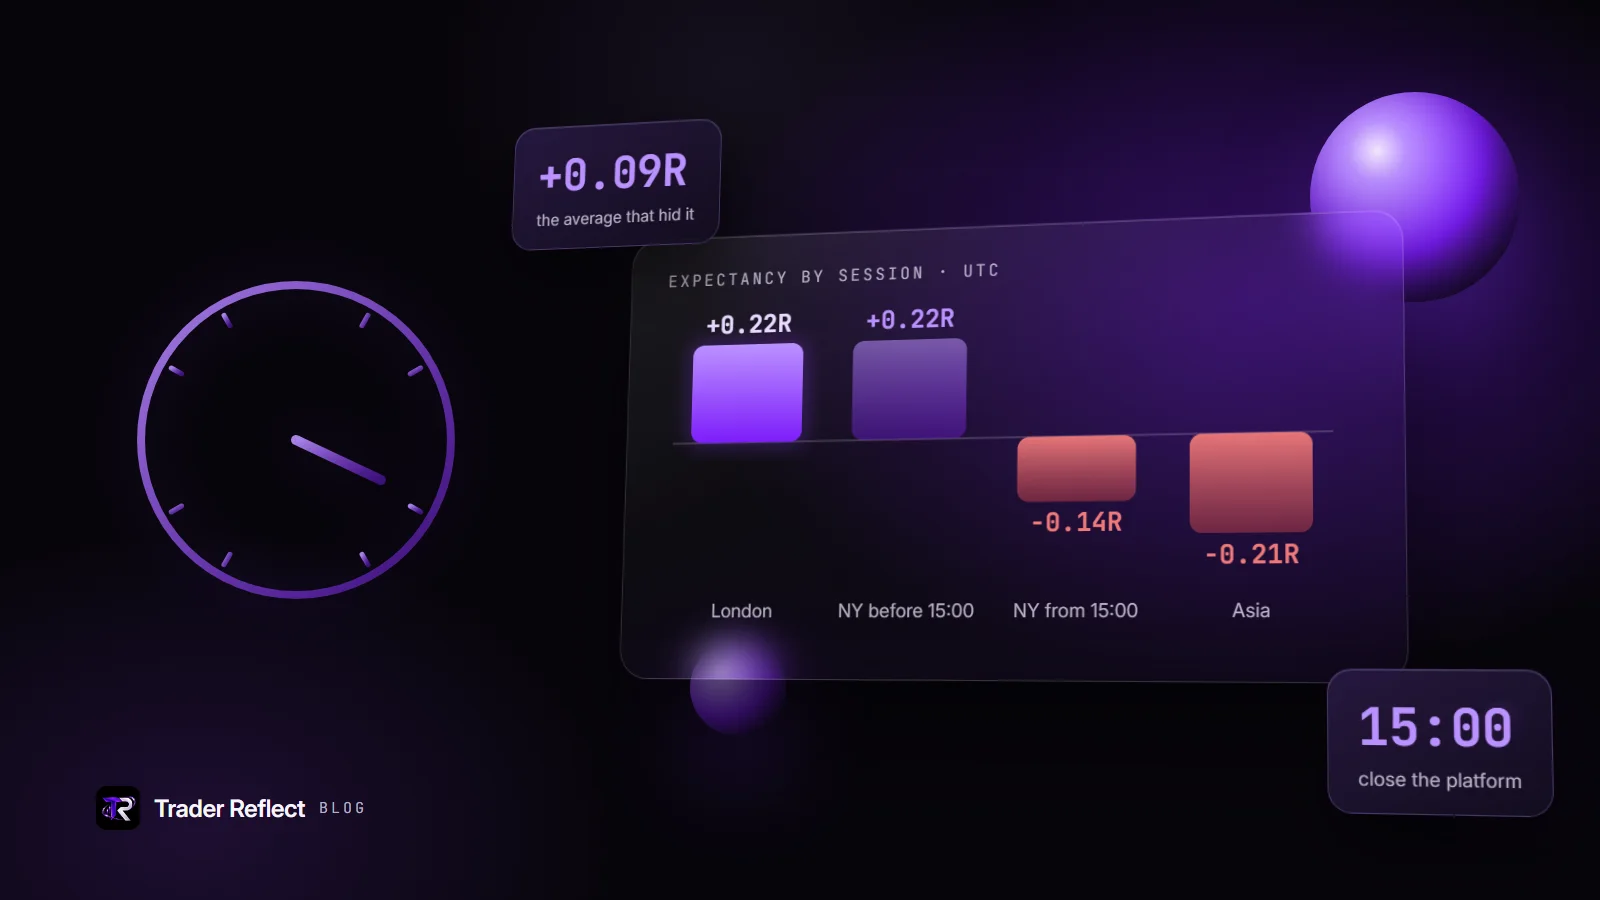
Suppose your record shows +0.09R per trade over 120 trades. It is easy to stop there. But an average is a blend. If one part of your day earns +0.22R per trade and another loses 0.14R per trade, the blend can still look fine while the losing part keeps running quietly in the background.
R keeps the comparison fair. 1R is the amount you risked on a trade, and a trade's result in R is its profit or loss divided by that initial risk. Because R ignores account size and position size, a trade from March and a trade from September can sit in the same bucket. Expectancy in R walks through the arithmetic in full. This needs a stop defined at entry; if your stops and targets are loosely planned, ChartViews' guide to the risk-reward ratio is a good place to start.
Split your record by session and by hour
Use UTC for everything. Local time shifts with daylight saving, and your broker's server time may differ again, so UTC is the only clock that stays put across a year.
Then fix your session boundaries once and keep them. Sessions overlap in reality, but for this exercise each trade should land in exactly one bucket, assigned by its entry time. One workable set:
- Asia: 00:00 to 07:00 UTC
- London: 07:00 to 13:00 UTC
- New York: 13:00 to 21:00 UTC
The exact edges matter less than consistency. Here the London and New York overlap counts as New York; just never change it halfway through.
For each bucket, add up the R results and divide by the number of trades. Here is an illustrative example, not a statistic about traders in general:
- London: 56 trades, +12.3R in total, so 12.3 ÷ 56 = +0.22R per trade
- New York: 46 trades, +2.3R in total, so +0.05R per trade
- Asia: 18 trades, −3.8R in total, so −0.21R per trade
Together that is 120 trades and +10.8R, which gives the +0.09R baseline. Now split the New York trades by hour. Say the 24 trades entered before 15:00 UTC made +5.3R (+0.22R each) and the 22 entered from 15:00 onwards lost 3.0R (−0.14R each). The session average of +0.05R was hiding two quite different halves.
Always compare a bucket with your own baseline, not with zero. A bucket at +0.02R in a record that averages +0.30R is a weak spot, even though it is positive.
How many trades a bucket needs
Small buckets are mostly noise, and the eye finds patterns in noise easily. Kahneman (2011) describes how readily people trust conclusions drawn from small samples.
A rough way to see the problem: the wobble in an average shrinks with the square root of the number of trades. Suppose your individual results typically sit about 1.2R either side of your average, a plausible spread when losses sit near −1R and winners range up to +3R. For a bucket of 22 trades, the uncertainty is about 1.2 ÷ √22 ≈ 0.26R, and a sensible range is about twice that in each direction. So the −0.14R late-session figure is consistent with anything from roughly −0.65R to +0.37R. It is a hint, not a finding. To halve that range you need four times as many trades.
A few working habits keep you honest:
- Below about 20 trades, write "not enough data yet" and move on.
- Between roughly 20 and 50 trades, treat a gap as something to watch, not a conclusion.
- Check whether the gap survives the next batch of trades before you believe it.
- Slice your record a few ways, not twenty. With enough slices, one will look terrible by chance alone.
The 18 Asia trades in the example belong firmly in the first group, however striking −0.21R looks. The 22 late New York trades belong in the second.
Fatigue is one possible reason, not a diagnosis
If a gap persists, the next question is why. Tiredness is one candidate. Killgore (2010) reviewed research on sleep deprivation and found that it impairs attention and working memory, with effects on more complex judgement and decision-making that are real but less consistent. Late in a long session, or after a short night, those are exactly the capacities that reading a chart and following a plan depend on.
That is research on sleep loss in general, though, not evidence about you. Other explanations fit the same pattern just as well: the market may behave differently at that hour, your best setups may simply occur earlier, or late trades may be the ones taken to win back an earlier loss. If that last one sounds familiar, revenge trading in your own record shows how to check for it. Your journal can show when results drop. On its own it usually cannot show why, so add a short note on how rested you felt and let a few weeks of entries narrow it down.
Turn the finding into a rule tied to the clock
A vague intention like "I will stop when I feel tired" fails because tiredness is hard to judge from inside it. A clock is not. Gollwitzer (1999) described implementation intentions, plans in the form "if situation X, then I do Y", and a meta-analysis of 94 studies by Gollwitzer & Sheeran (2006) found a medium-to-large effect on goal attainment (d ≈ 0.65). Those studies were not about trading, and an average across many people promises nothing about one, but the format suits this problem well.
For the example above, the rule could be:
If the clock reaches 15:00 UTC, I close the platform and write one line about the session.
The second half matters. Writing one line gives the session a clear ending and leaves a note you can review later. Set an alarm so the cue does not depend on you noticing the time.
Treat the rule as an experiment. Run it for the next 30 or 40 trades, then compare your expectancy with the period before, knowing the comparison will still be tentative. A cheap rule does not need proof before you try it, but it does need a fair test. If-then plans for traders covers how to write and check these rules in more detail.
Why late-session damage costs more in a prop challenge
If you trade a funded-account challenge, a weak hour is more expensive than its R average suggests. Many challenges set a daily loss limit, and breaching it can end the attempt however well the rest of the month went. If your limit is 5% and you risk 1% per trade, you have 5R of room in a day. Be at −2R by 15:00 UTC, keep trading through your weakest hours, and the remaining 3R can go in a handful of trades. Money Circle's explainer on what a prop firm challenge is covers how these limits usually work. A clock rule protects the daily limit as well as the average.
See your own hours and sessions
Trader Reflect reads your Money Circle journal, shows your expectancy in R by hour and by session against your baseline, names the one habit costing you most and gives you one if-then action to test. You can open Trader Reflect from your Money Circle Journal. It is included with paid Money Circle membership, so if you are not a member yet, see what membership includes.
Educational content, not financial advice. Trading involves risk of loss.