
Latest articles
Trader Reflect Blog
The habits that cost traders money, and how to find them in your own record — with the arithmetic, and without a single price prediction.
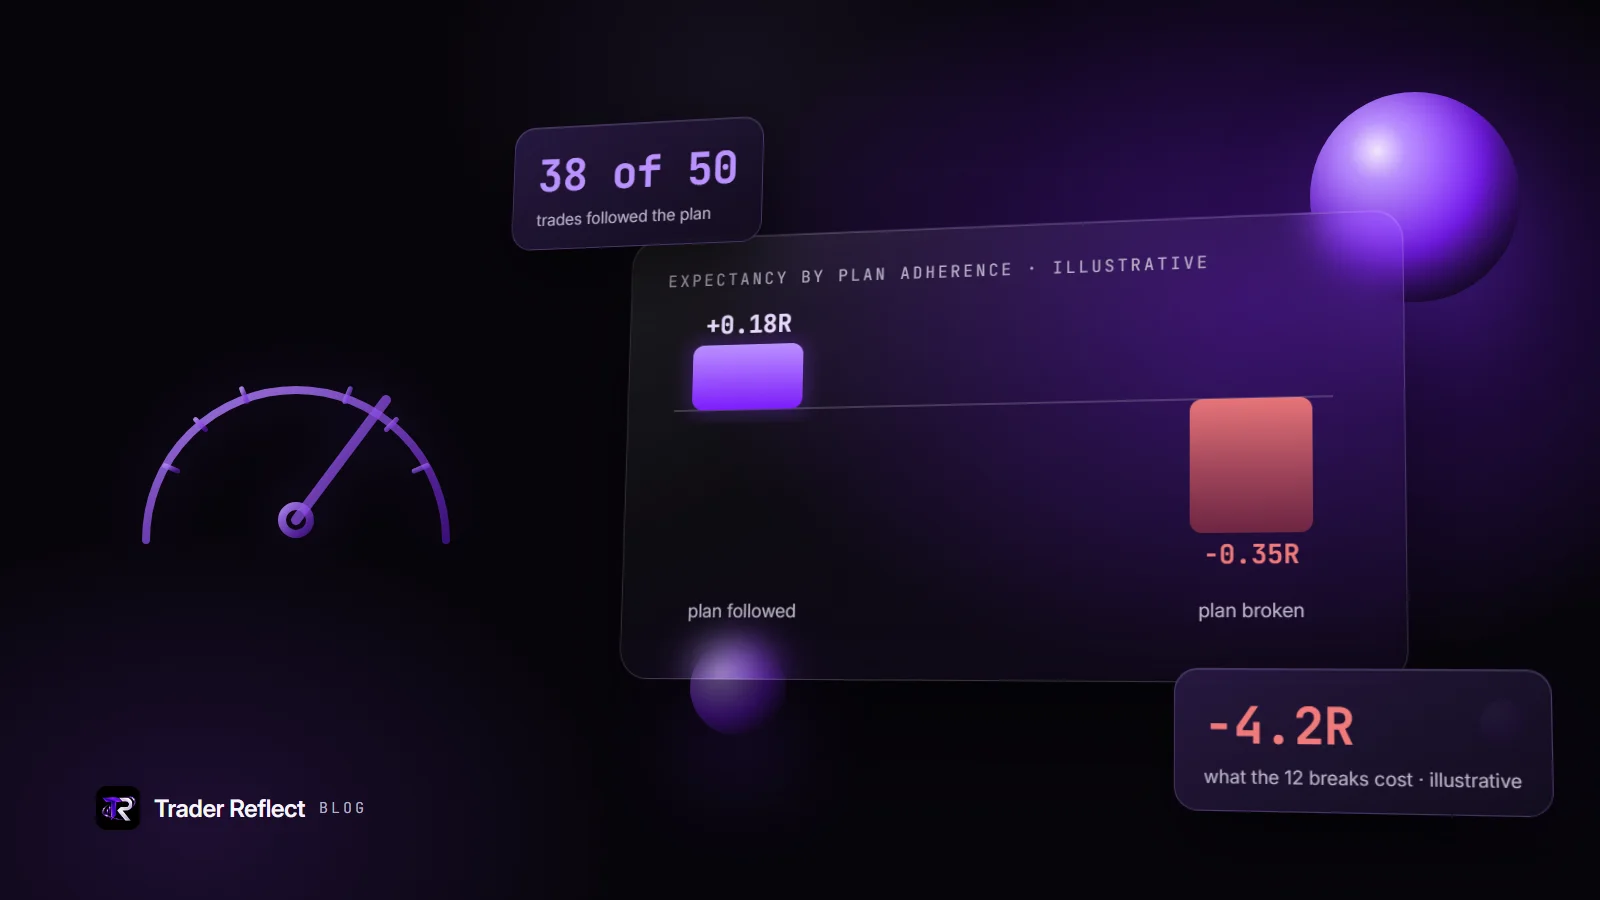
24 October 2026 · 6 min readMeasuring Discipline as a Trader: Plan Adherence and What It CostsTurn discipline into a number: mark each trade against checkable rules, then compare the result in R of followed and broken-plan trades.BehaviourPerformanceRead the article
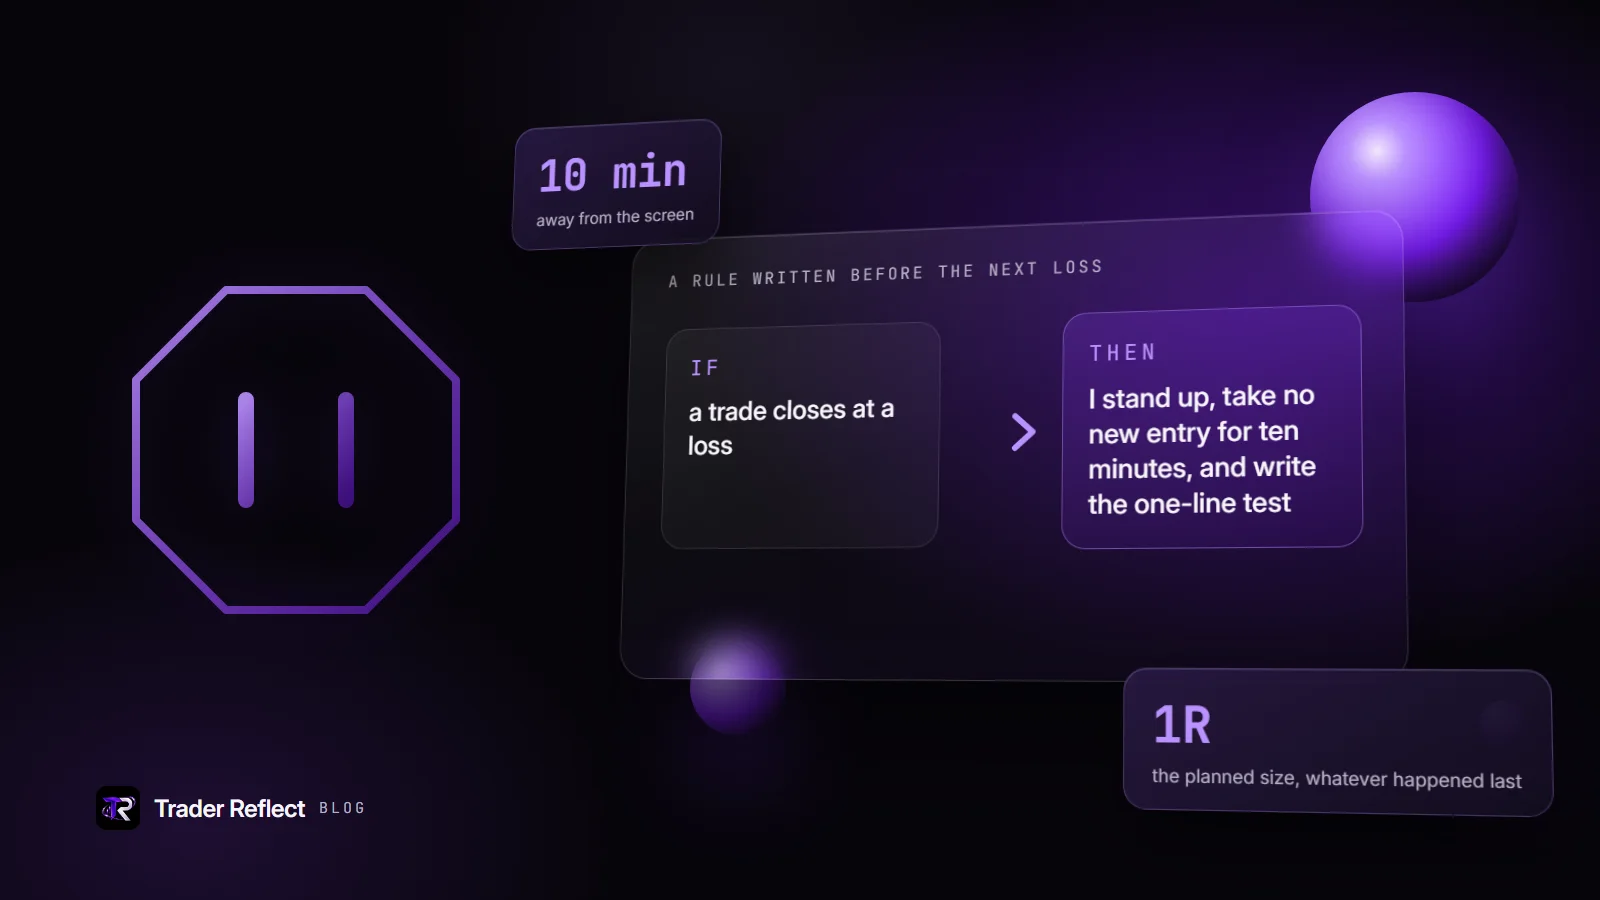
24 October 2026 · 6 min readRevenge Trading: How to Recognise It and Stop ItHow to spot revenge trading at the desk, why willpower fails, and four rules set in advance that interrupt it, plus a way to check they work.BehaviourLossesRead the article
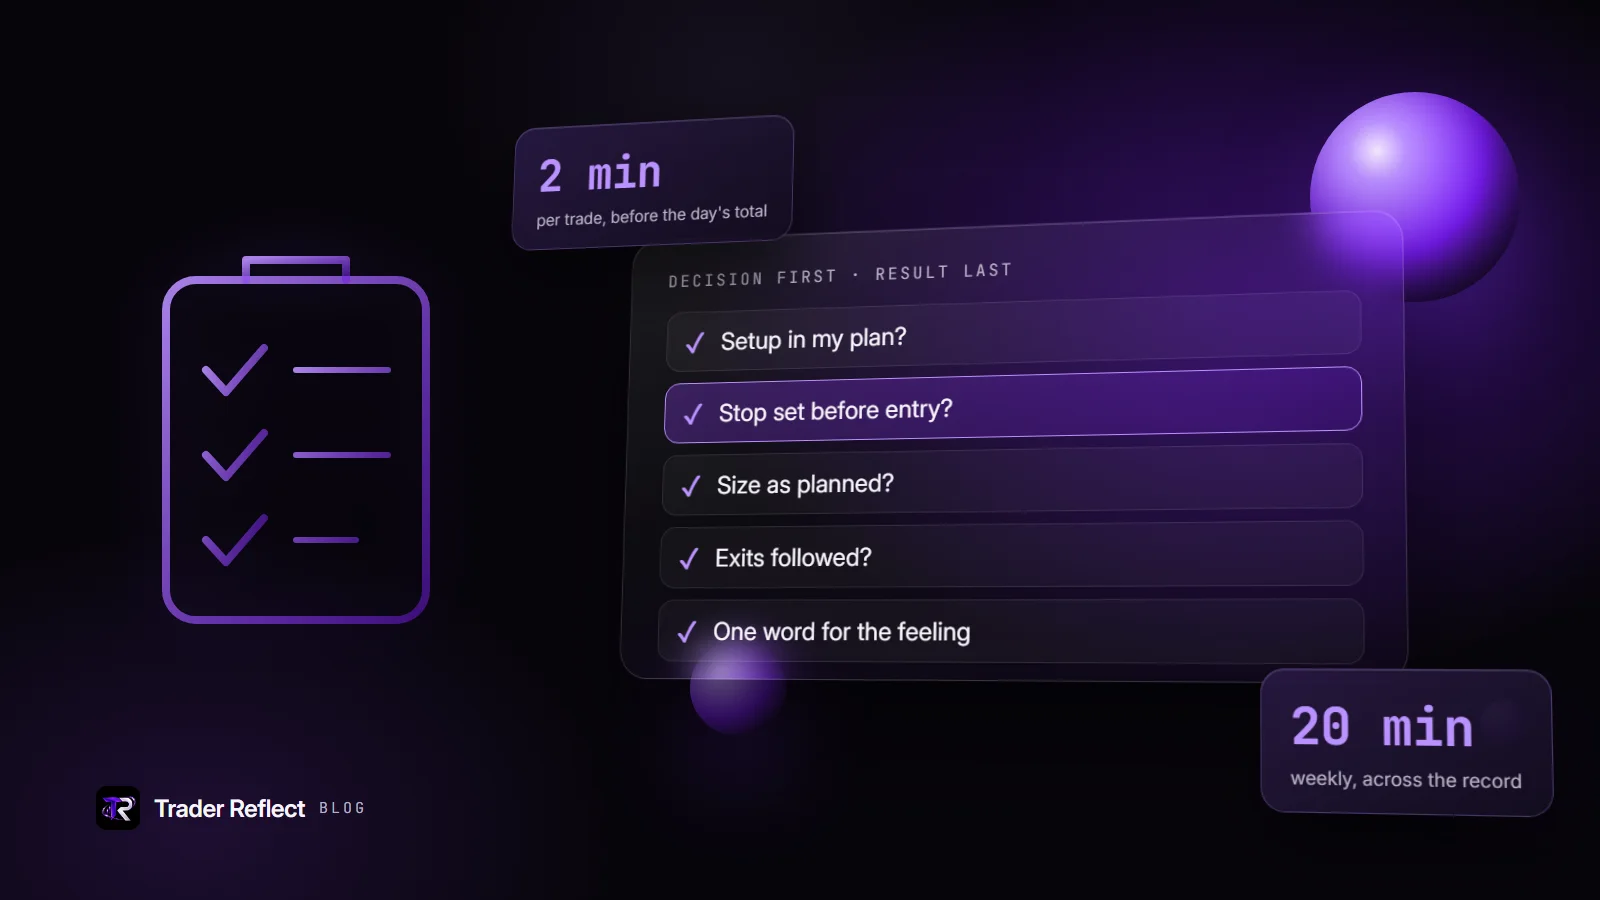
24 October 2026 · 6 min readThe Post-Trade Review Checklist: Judge the Decision, Not the ResultA two-minute checklist to review each trade by decision quality, a twenty-minute weekly review, and the usual ways reviews fail.JournalingProcessRead the article

24 October 2026 · 6 min readWhy Your Win Rate Lies: Expectancy and R ExplainedA 70% win rate can lose money and a 35% one can make it. Worked arithmetic with expectancy and R, and what to track instead.PerformanceRiskRead the article
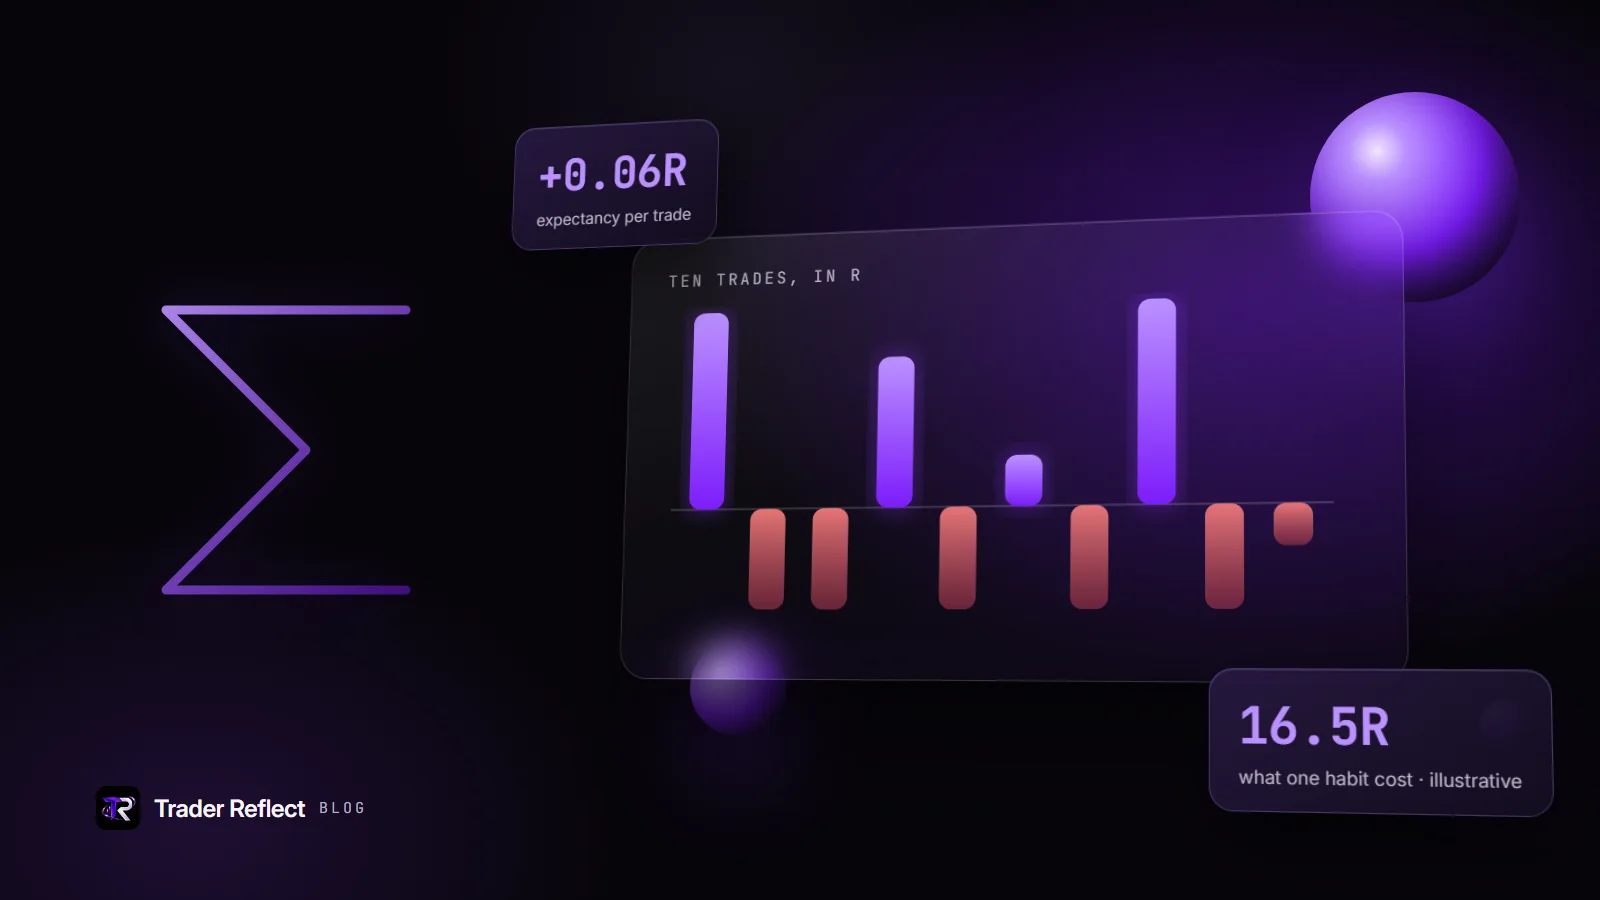
14 October 2026 · 6 min readExpectancy in R: The One Number That Shows What a Habit CostsWhat R and expectancy mean, how to calculate them, and how to compare a habit's trades with your baseline without being fooled by small samples.PerformanceRiskRead the article
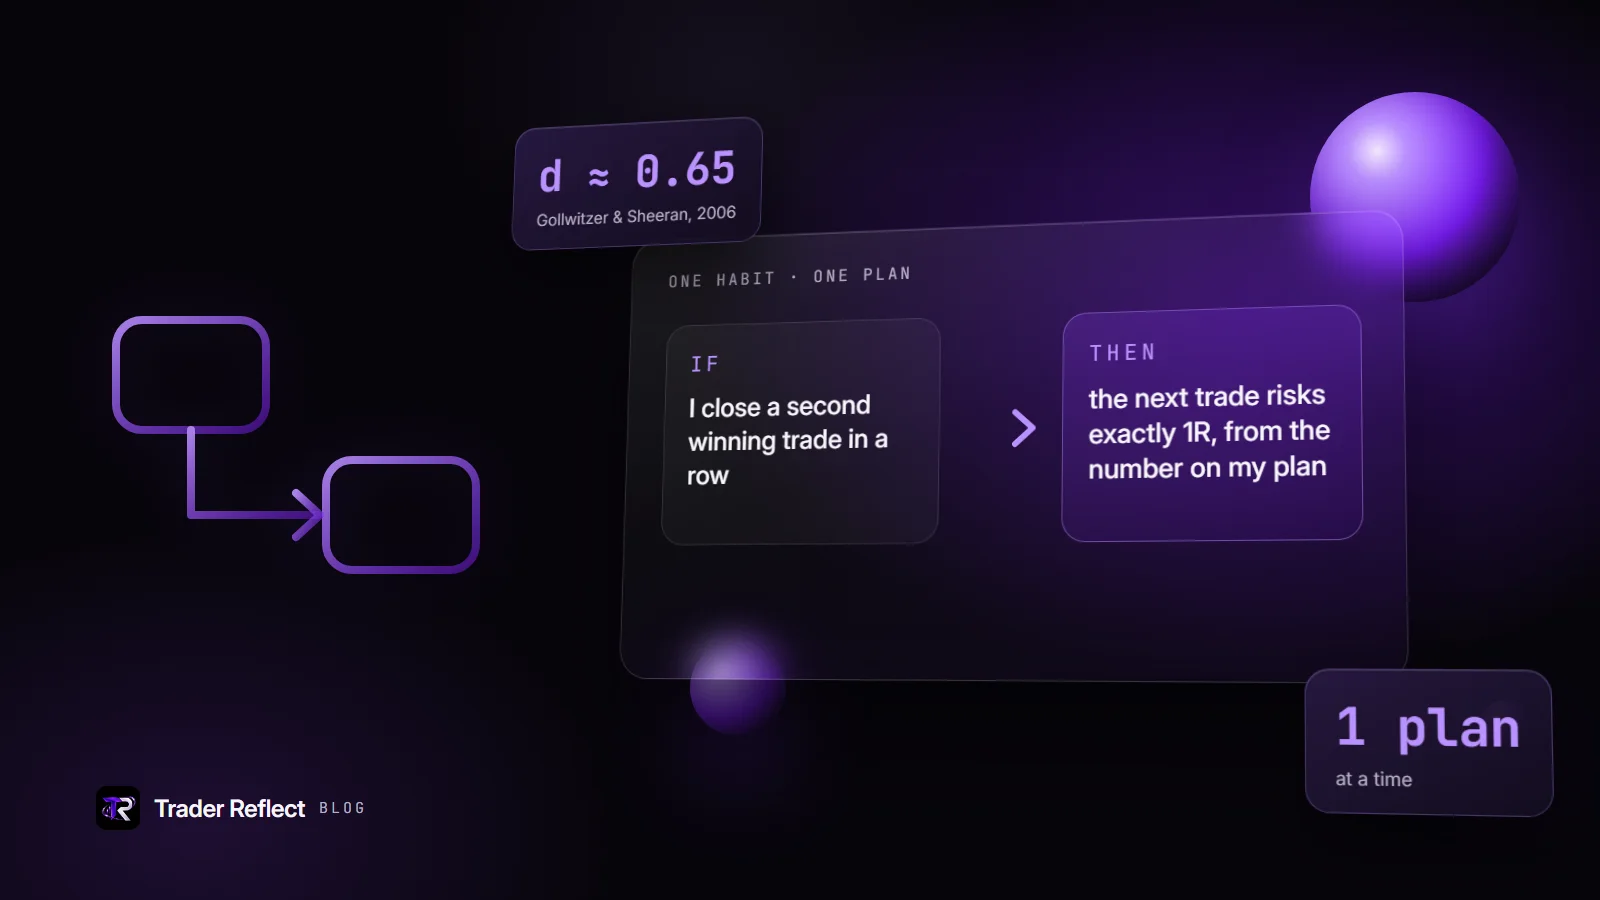
14 October 2026 · 7 min readIf-Then Plans: The Research-Backed Way to Change One Trading HabitWhy good intentions fail at the desk, how if-then plans work, five worked examples for costly trading habits, and how to check you kept one.HabitsPlanningRead the article
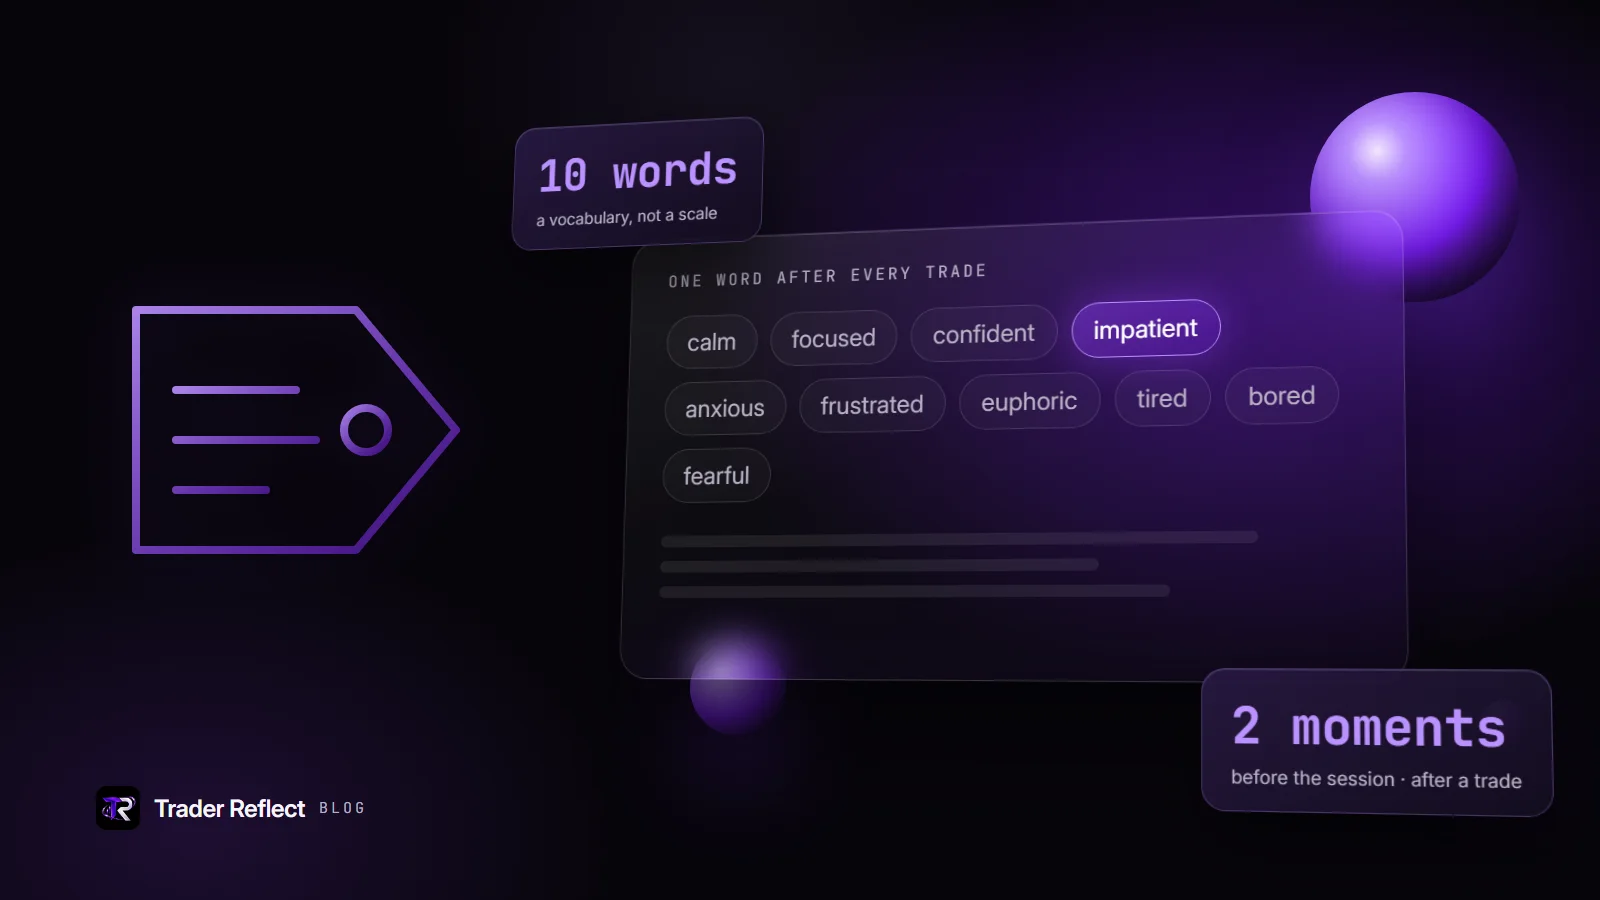
14 October 2026 · 6 min readName the Feeling: Why One Emotion Word in Your Journal HelpsWhy naming one emotion in your journal can help, a short vocabulary to use, when to log it, and how to read the labels against your results in R.EmotionsJournalingRead the article
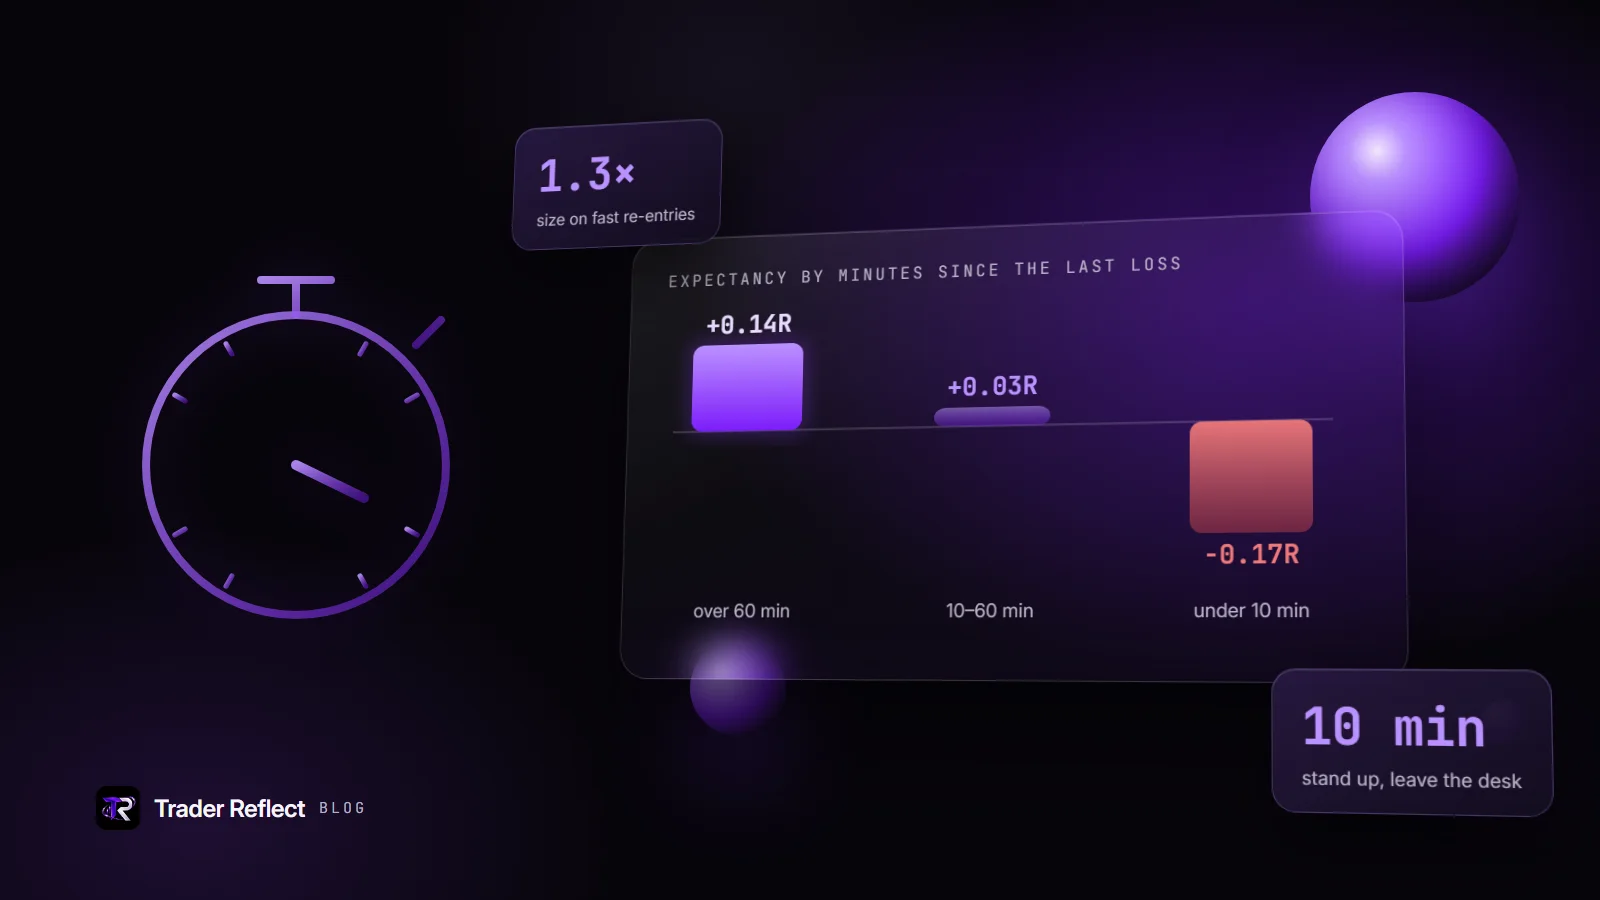
14 October 2026 · 6 min readRevenge Trading: How to Spot It in Your Own Trade RecordRevenge trading in a trade record: quick re-entries after a loss, larger size, lower expectancy in R. How to check your own, and a ten-minute rule.BehaviourLossesRead the article
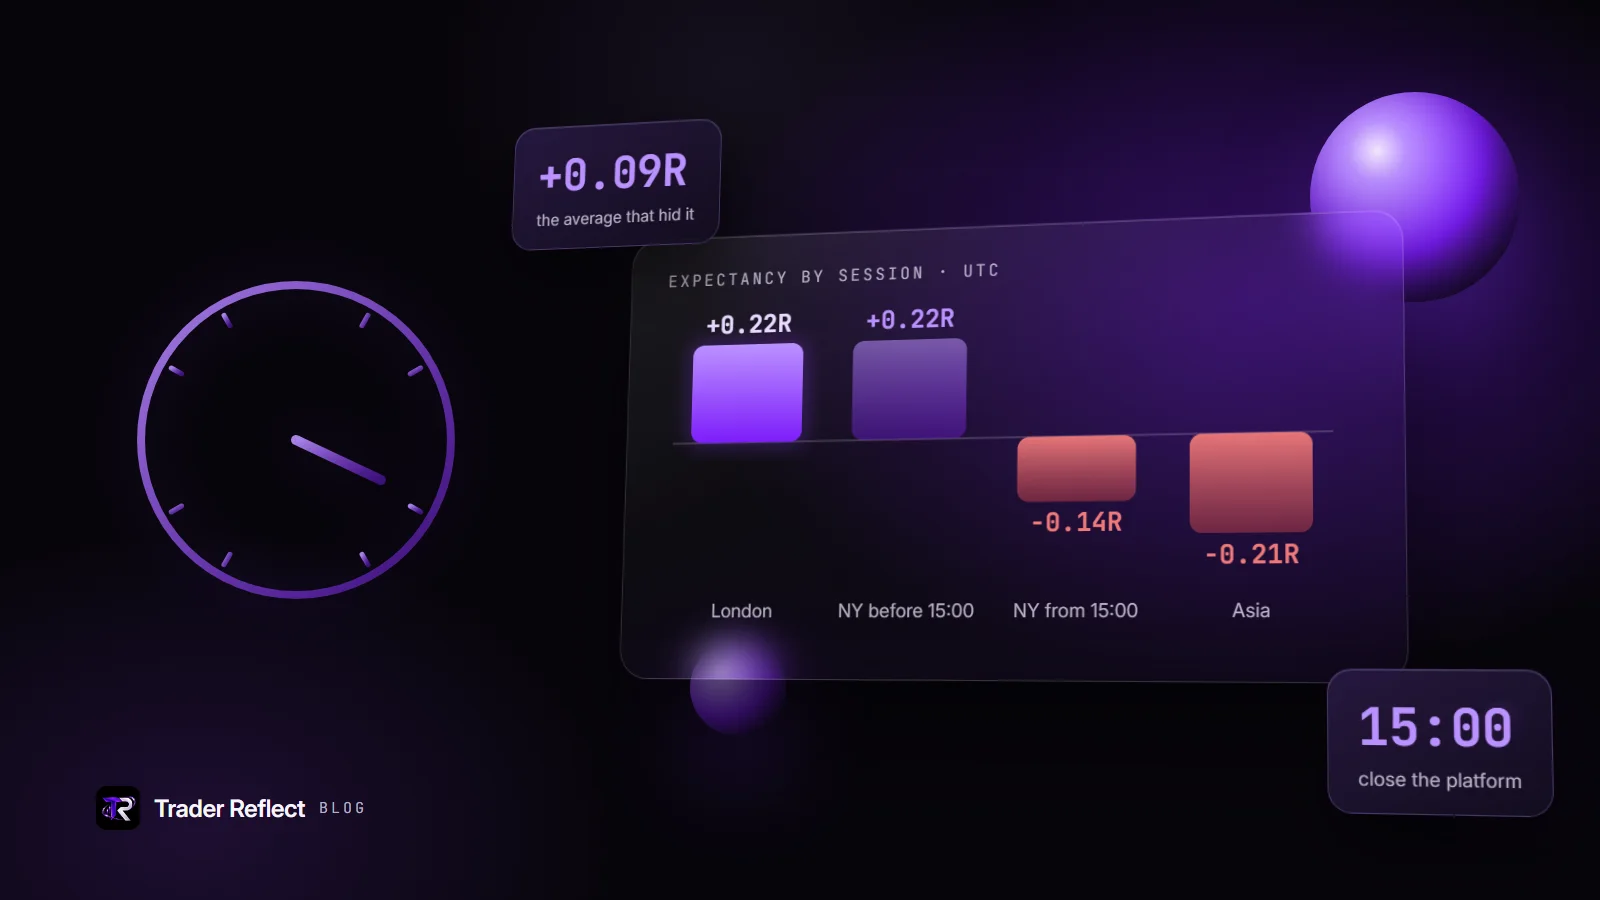
14 October 2026 · 6 min readWhen Your Edge Fades: Reading Your Results by Hour and SessionHow to split your trading record by hour and by session, compare expectancy in R, and turn a real weak spot into one rule tied to the clock.PerformanceSessionsRead the article
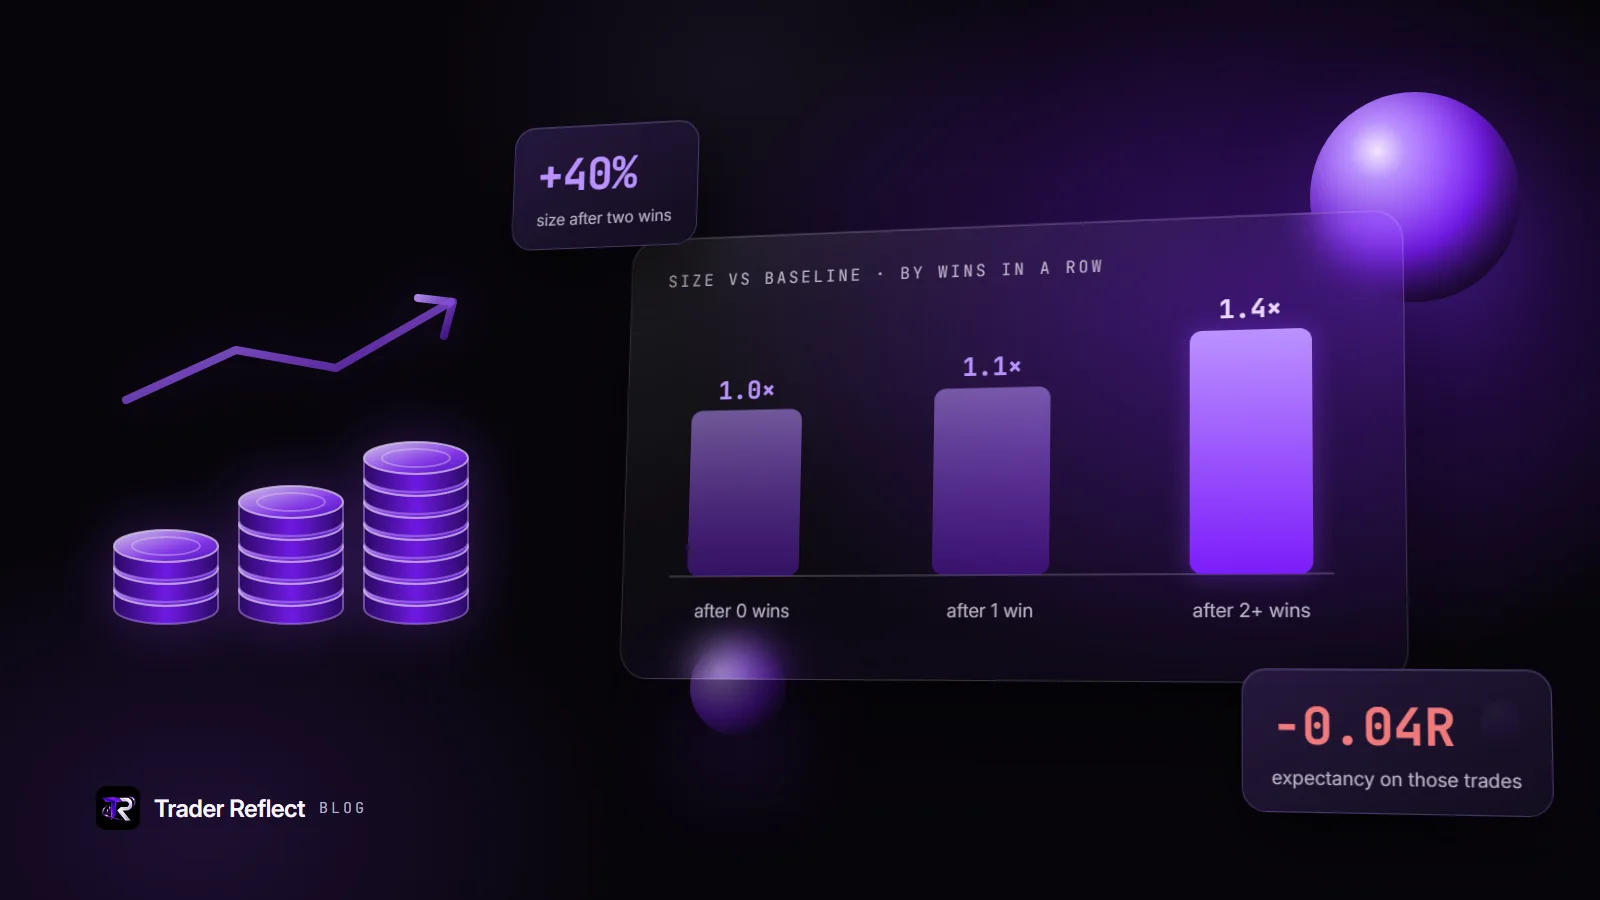
14 October 2026 · 7 min readWhy Traders Size Up After a Winning Streak, and How to Check If You DoAfter a few wins, position size often creeps up while expectancy does not. How to measure it in R in your own record, and an if-then cap that stops it.BehaviourPosition sizingRead the article
Glossary
Trading psychology and journaling, defined
From the network
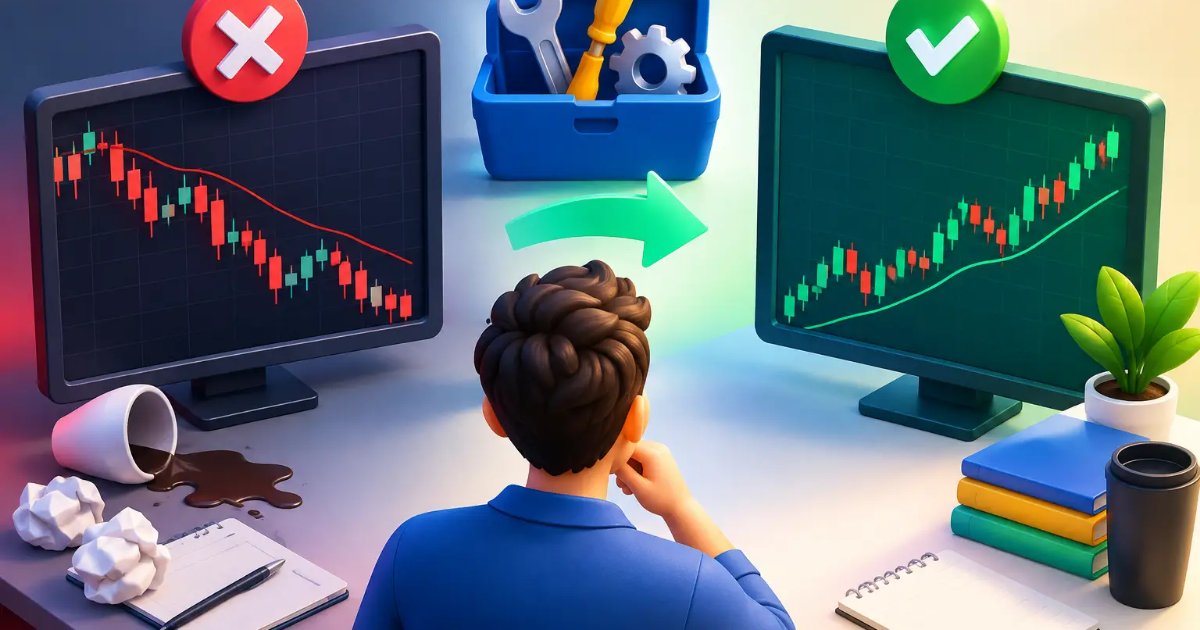 ChartViews AI Blog · Reading charts and planning a tradeWhy Do Trade Setups Fail? 8 Fixes That MatterWhy do trade setups fail? Learn the eight execution, risk, and market-context errors that turn promising chart ideas into costly trades for active traders.Money Circle Blog · Learning, journaling and the trading processGold Slides 4% as Stocks Mix and Central Banks LoomGold fell 4.14% in a mixed week for US indices, with the Fed, ECB, US GDP and core PCE all due in the days ahead.