Two or three winning trades in a row feel like information. Often the next position is a little larger, not because the setup is better but because you feel sharper. This post explains why that drift is common, how to check whether it shows up in your own trade record, and a simple if-then cap that stops it without relying on willpower.
What the pattern looks like
The pattern is easy to describe and hard to notice from the inside. After a loss or a flat day, you risk your normal amount, say 1R. After one win, you probably still risk 1R. After two or three wins, the next trade risks 1.3R or 1.5R. Sometimes you add size, sometimes you widen the stop without reducing size, sometimes you take a setup you would normally skip.
Each decision feels reasonable at the time. You have been reading the market well, so a bit more size seems earned. The problem is that the size moves while the expectancy on those trades usually does not. If your edge after two wins is the same as your edge after a loss, sizing up adds swing without adding return. If your edge after two wins is worse, because you have become looser, the larger size lands on your weakest trades.
Why it happens
Two well-documented tendencies point in the same direction.
The first is overconfidence. Barber & Odean (2000) studied households at a discount brokerage and found that those who traded most earned less, after costs, than those who traded least. They pointed to overconfidence as a likely reason: people overrate the accuracy of their own judgement and act on it more often than the evidence supports. A winning streak is exactly the moment that belief feels most justified.
The second is over-reading short streaks. Gilovich, Vallone & Tversky (1985) showed that people see "hot hands" in basketball shooting sequences that are close to random. That finding is now debated: Miller & Sanjurjo (2018) showed a statistical bias in the original analysis, so whether hot hands exist in basketball is still argued over. The safe point is narrower. People are quick to read meaning into two or three outcomes, far quicker than the sample justifies. Kahneman (2011) describes the same habit more broadly: the mind builds a confident story from very little evidence.
In trading, a run of three wins is not rare. At a 40% win rate, the chance that three given trades all win is 0.4 × 0.4 × 0.4 = 0.064, about 1 in 16. Across 300 trades you should expect around a dozen such runs by chance alone. None of these studies proves anything about you in particular. They are reasons to check.
How to check your own record
You need three things for each trade, in time order: how much you risked, the result, and when it happened. If your journal does not already capture risk per trade, the ChartViews guide to fixed-percentage position sizing gives you a baseline to measure against.
- Set your baseline risk. This is your standard planned risk per trade, for example 1% of the account. Call it 1.0.
- For each trade, work out the size ratio: amount risked divided by baseline. A trade risking 140 against a 100 baseline has a ratio of 1.4.
- Work out each trade's R-multiple: result divided by the amount risked on that trade. A 280 gain on 140 risked is +2R.
- Tag each trade with the number of consecutive wins immediately before it: 0, 1 or 2+. Decide once how to treat break-even trades, for example by leaving them out of the count, and apply that rule everywhere.
- For each bucket, record the number of trades, the average size ratio and the expectancy, which is the average R-multiple.
Keeping size and R-multiple separate matters. It lets you see whether you sized up and, independently, whether the trades you sized up on were any good. If expectancy is new to you, Expectancy in R walks through the calculation.
A worked example
Suppose a trader's own record holds 120 trades, with wins averaging about +2R and losses about −1R, the kind of profile described in the ChartViews risk-reward ratio explainer.
- After 0 wins (60 trades): average size 1.0. 24 wins at +2R = +48R, 36 losses at −1R = −36R. Net +12R, so expectancy is 12 ÷ 60 = +0.20R.
- After 1 win (35 trades): average size 1.1. 14 wins at +2R = +28R, 21 losses at −1R = −21R. Net +7R, expectancy 7 ÷ 35 = +0.20R.
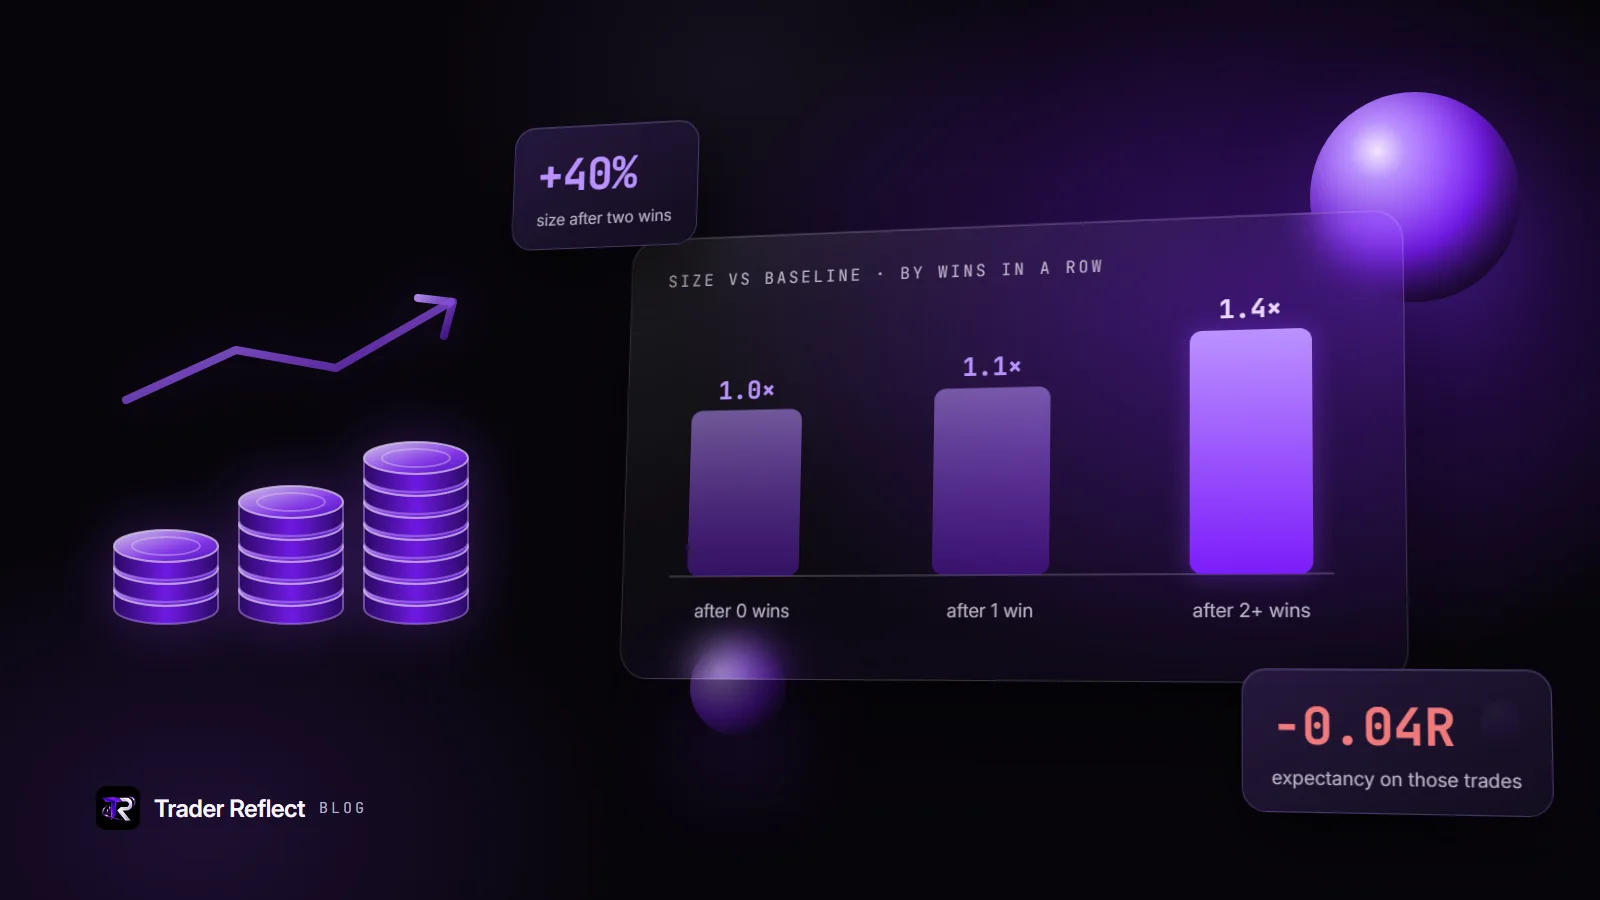
- After 2+ wins (25 trades): average size 1.4. 8 wins at +2R = +16R, 17 losses at −1R = −17R. Net −1R, expectancy −1 ÷ 25 = −0.04R.
Size rose 40% after two wins. Expectancy did not rise with it. In baseline terms, the 2+ bucket lost about 1R × 1.4 = 1.4R, where the same trades at normal size would have lost about 1R.
Read the result with care
Twenty-five trades is a small sample. At a 40% win rate you would expect about 10 wins in 25 trades, and getting 8 is well within ordinary variation. So the drop from +0.20R to −0.04R might be real, or it might be noise. You would want considerably more trades in the 2+ bucket before concluding that your edge actually worsens after a streak.
The size figure is different. Size is your own decision, recorded exactly, so an average of 1.4 is not noise. It is a fact about your behaviour. And you do not need expectancy to get worse to justify acting. If expectancy after two wins is merely the same as your baseline, sizing up adds variance without adding edge. That alone is a reason to cap it.
If your 2+ bucket shows no size drift, that is useful too. You have ruled out one habit and can look elsewhere.
The fix: an if-then cap set before the chart
A general intention like "stay disciplined after wins" tends to dissolve at the moment it is needed. Specific if-then plans hold up better. Gollwitzer (1999) called these implementation intentions, and a meta-analysis of 94 studies by Gollwitzer & Sheeran (2006) found a medium-to-large effect on reaching goals (d ≈ 0.65). Those studies were not about trading, so treat the effect size as encouraging rather than as a promise.
A cap for this habit might read:
If I have just closed my second winning trade in a row, then my next trade risks 0.75R, and I write that number down before I open the chart.
Two details do the work. First, the size is decided before you look at the chart, because the chart will always offer a reason for an exception. Second, 0.75R sits below baseline on purpose. It leaves a margin for the pull you will feel anyway. Keep the cap for every trade until a loss resets the count.
The cost is small. In the example above, if the 2+ bucket really earned +0.20R like the others, trading those 25 trades at 0.75 instead of 1.0 would give up 25 × 0.25 × 0.20R = 1.25R. If the bucket is as weak as it looks, the cap cuts the damage from about 1.4R to about 0.75R. For more on writing rules like this, see If-then plans for traders.
Review the buckets again once another 30 or so trades have landed in the 2+ group. If size has settled and expectancy there matches your baseline, you can consider returning to 1R.
Let Trader Reflect run the buckets
Building these buckets by hand works, but it is tedious to repeat every month. Trader Reflect reads your Money Circle journal, checks your size after win streaks alongside expectancy in R, and names the one habit costing you most, with the numbers behind it and one if-then action. You can open Trader Reflect from your Money Circle Journal. It is included with paid Money Circle membership, and you can see what membership includes before deciding.
Educational content, not financial advice. Trading involves risk of loss.