Every trading habit has a price, but you rarely see it in your balance. Gains and losses blur together, position sizes change, and a win rate tells you how often you were right but not what it was worth. Expectancy in R is a single number that strips those distortions away, so you can see what a habit costs per trade. This post defines it, works through the arithmetic and covers the mistakes that make it mislead.
What R means
R is a unit of risk. 1R is the amount you risked on a trade: the distance from entry to your initial stop, multiplied by your position size. A trade's result in R is its profit or loss divided by that initial risk.
Some examples, with 1R = 100 in your account currency:
- You close the trade 150 in profit: 150 ÷ 100 = +1.5R.
- You are stopped out for 100: −1R.
- The stop fills with slippage and you lose 130: −1.3R.
- You exit early for a profit of 40: +0.4R.
1R means the same thing whether your account is 2,000 or 200,000, and whether you risked 0.5% or 2%. If you size by a fixed percentage of the account, ChartViews' guide to position sizing with fixed percentage risk explains how 1R is set in the first place.
Expectancy: the average R per trade
Expectancy is the average result per trade, measured in R. Add up the R results and divide by the number of trades.
Take ten trades: +2, −1, −1, +1.5, −1, +0.5, −1, +2, −1, −0.4. They sum to +0.6R, so expectancy is 0.6 ÷ 10 = +0.06R per trade.
A second formula gives the same number and shows where it comes from:
Expectancy = win rate × average win − loss rate × average loss
In those ten trades there are four wins (+2, +1.5, +0.5, +2) totalling 6.0R, so the average win is 1.5R. There are six losses totalling 5.4R, so the average loss is 0.9R. That gives 0.4 × 1.5 − 0.6 × 0.9 = 0.60 − 0.54 = +0.06R. Same answer.
The formula makes one thing obvious: win rate alone says very little. A trader who wins 70% of the time, with an average win of 0.4R and an average loss of 1.2R, has 0.7 × 0.4 − 0.3 × 1.2 = 0.28 − 0.36 = −0.08R per trade. Right more often, and still losing.
Why R beats currency and win rate
Results in currency mix two things: the quality of your decisions and the size you happened to trade. A loss of 200 is a full stop-out when 1R is 200, and less than half of one when 1R is 500. If you risked 0.5% per trade in spring and 1% in autumn, comparing profit in currency across those months mostly measures the change in size.
R removes that, so a habit's trades can be compared with the rest of your record across different account sizes, instruments and stop distances.
Win rate fails because it ignores how big the wins and losses were. Many habits change that balance without moving the win rate much. Shefrin & Statman (1985) described the disposition to sell winners too early and ride losers too long. A habit like that can leave your win rate roughly where it was while your average win shrinks and your average loss grows, and only expectancy shows the damage.
One caveat: because R measures results per unit of risk, it hides sizing habits. If you double your risk after a winning streak, a stop-out on one of those trades still shows as −1R, but it costs twice as much money. For sizing habits, look at expectancy in R and at the risk you took, side by side. Why traders size up after a winning streak goes into that pattern.
Comparing a habit with your baseline
The useful question is not "is this habit positive?" but "is it worse than how I usually trade?" Your baseline is your expectancy across the trades outside the habit, so the habit's own trades do not pull it towards them. The habit's number is the expectancy of the trades where it shows up.
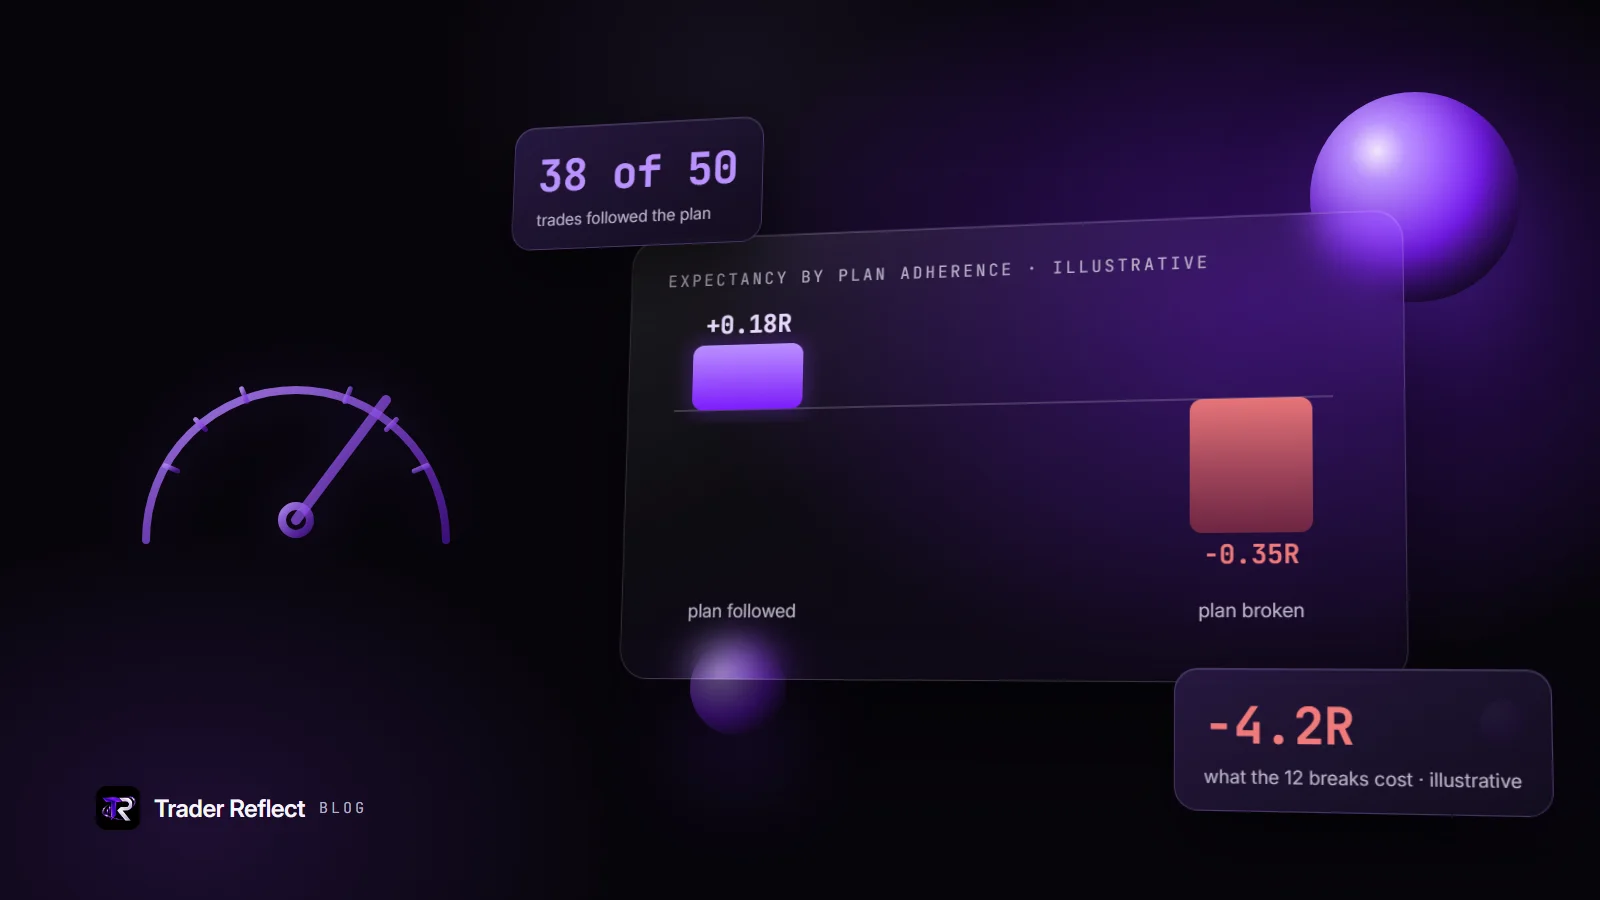
Here is an illustrative example, not a statistic about traders in general. Say your baseline is +0.18R per trade, and you tag every trade entered straight after two wins in a row. There are 33 of them, and they average −0.32R.
- The gap is 0.18 − (−0.32) = 0.50R per trade.
- Those 33 trades lost 33 × 0.32 = 10.56R in total.
- At your baseline they would have made 33 × 0.18 = 5.94R.
- The difference is 10.56 + 5.94 = 16.5R, which is what the habit cost over those trades.
That last figure is the one number in the title: the gap per trade multiplied by how often the habit occurs. It turns "I think I get careless after a couple of wins" into something specific enough to act on.
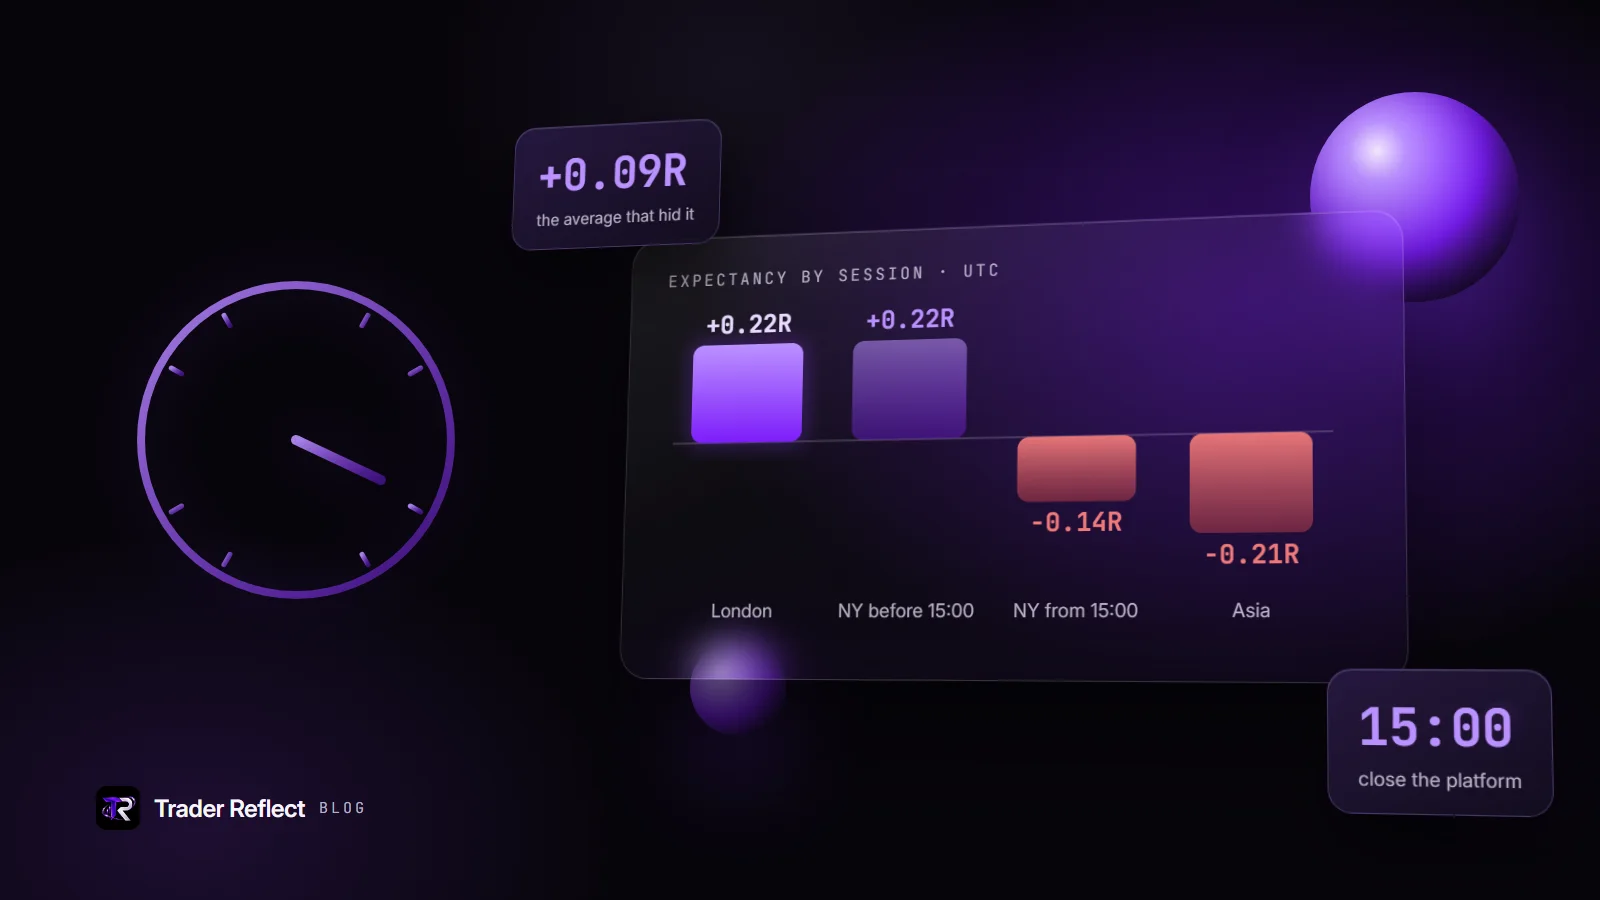
The same method works for any slice of your record, including time of day; when your edge fades applies it to hours and sessions.
Confidence and sample size
Thirty-three trades is a modest sample, and a handful proves nothing at all. Kahneman (2011) describes how readily people trust conclusions drawn from small samples.
The arithmetic shows why. In a bucket of 33 trades, a single +3R winner moves the average by 3 ÷ 33 ≈ 0.09R. In a bucket of eight trades, the same winner moves it by 3 ÷ 8 ≈ 0.38R. One lucky or unlucky trade can flip a small bucket from fine to alarming.
A few ways to stay honest:
- Below about 20 trades, call it "not enough data yet" rather than a finding.
- Prefer a cautious estimate to the raw figure. For a proportion, such as the share of post-streak trades that lose, a lower confidence bound such as Wilson's gives a deliberately conservative number that behaves sensibly with small samples. The idea carries over to averages: ask how good or bad the number could plausibly be, given how few trades sit behind it.
- Do not hunt through dozens of slices for the worst one; cut your record twenty ways and one cut will look alarming by chance.
- Check whether the gap holds over the next batch of trades before you treat it as real.
Common mistakes that distort expectancy
Using planned risk-reward instead of realised R
A trade planned at 1:3 that you closed at +1.2R counts as +1.2R, not +3R. A stop that slipped to −1.3R counts as −1.3R. Planned ratios describe intentions; expectancy has to describe what happened. ChartViews' risk-reward ratio explained covers the planning side.
Measuring R against a moved stop
If you moved the stop after entry, R still uses the initial risk. Otherwise a loss after widening the stop from 100 to 200 looks like an ordinary −1R when it was really −2R.
Mixing in trades without a stop
A trade with no stop at entry had no defined initial risk, so its R is undefined. Guessing a risk afterwards, or dividing by a typical figure, produces a number that looks precise and is not. Keep those trades out of the calculation and count them separately; how often you trade without a stop is a habit worth tracking on its own.
Recording too little to calculate R
You need entry, initial stop, size and exit for every trade, written down at the time. Money Circle's guide on what to record in a trading journal lists the fields.
Find what your habits cost
Trader Reflect does this arithmetic on your own record. It reads your Money Circle journal, compares habits such as size after win streaks or entries soon after a loss with your baseline in R, and names the one costing you most, with one if-then action to try. You can open Trader Reflect from your Money Circle Journal. It is included with paid Money Circle membership: see what membership includes.
Educational content, not financial advice. Trading involves risk of loss.