Most traders have a risk rule. Far fewer have checked whether they follow it. The gap between the risk you planned and the risk you actually took on each trade is one of the easiest things to measure and one of the most revealing. This post shows how to compute risk per trade in R, how to compare planned and actual risk, and what to do with the differences.
Risk per trade, defined
Risk per trade is the amount you stand to lose if your stop is hit, usually expressed either in money or as a percentage of your account. Many traders pick a fixed fraction, such as one percent of the account, and size each position so that the distance to the stop equals that amount.
The sizing arithmetic is simple. Take the amount you are willing to risk, divide by the distance between your entry and your stop (expressed in money per unit), and the result is the position size. For example, if you are willing to risk one hundred in account currency and the stop is fifty cents per share away, the size is two hundred shares. The numbers here are illustrative only, to show the method. The point is that size follows from the stop distance and the risk amount, not from a feeling about how confident you are.
The glossary entry on position sizing covers the common approaches, and ChartViews AI has a worked guide on position sizing basics with a fixed percentage of risk.
What 1R means
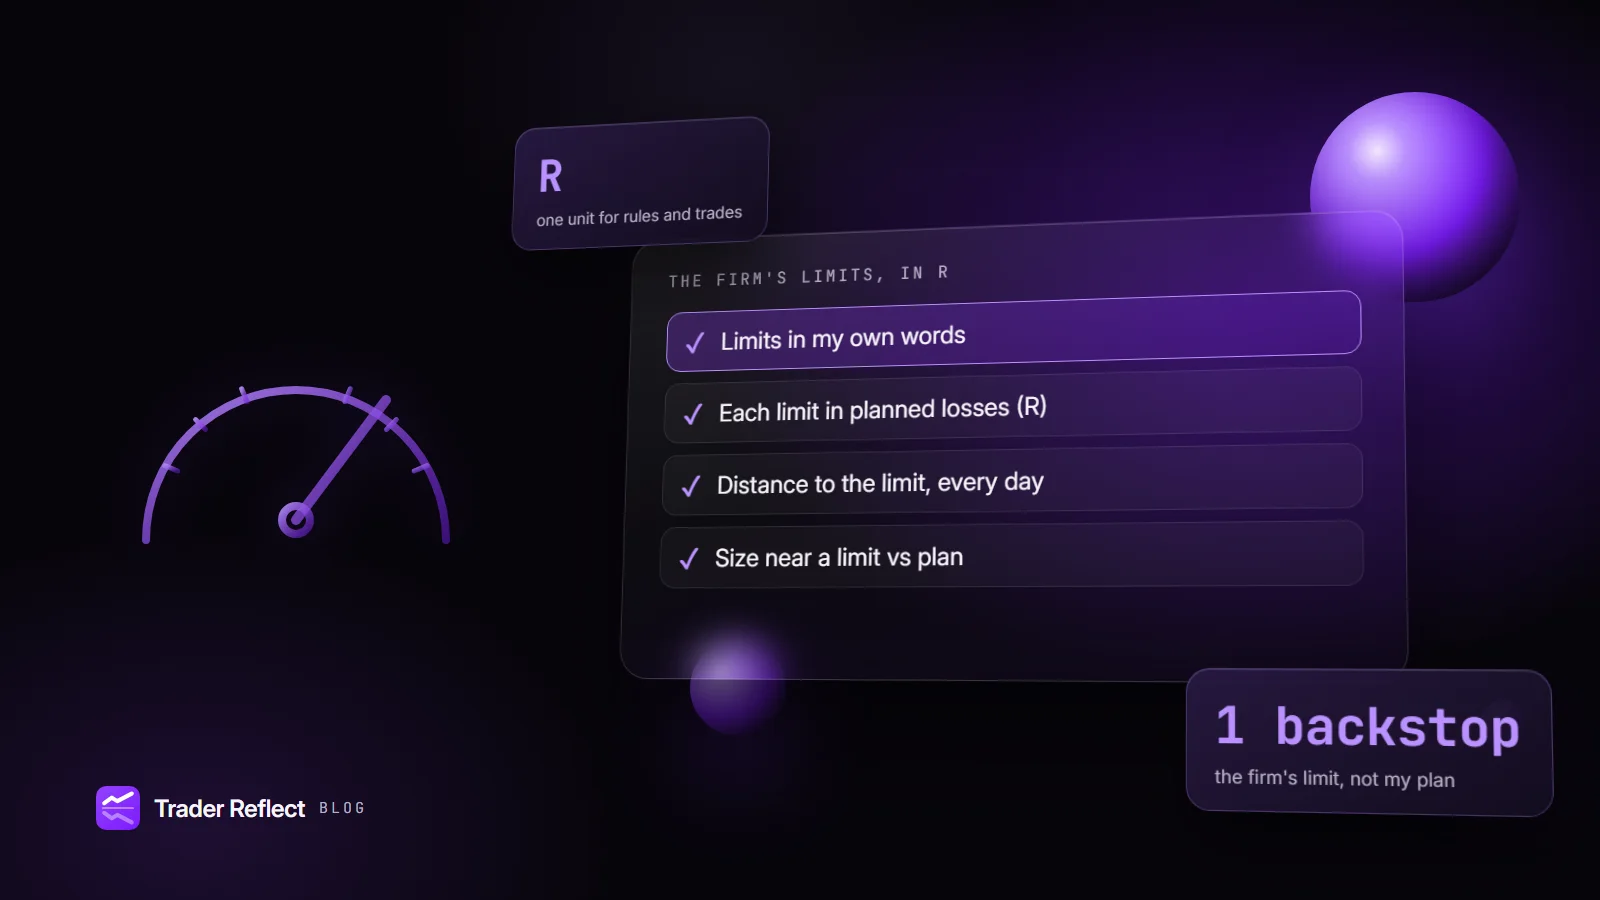
R is the unit that makes trades comparable. One R is the amount you risked at your initial stop on that trade. A trade that makes twice what you risked is +2R, and a trade stopped out at the planned level is −1R. Writing results in R removes the effect of account size and instrument, and it makes the discipline of sizing visible: if every trade risks the same amount, then 1R is the same money every time, and R results mean what they say. The entry on the R-multiple explains the unit.
If your risk varies from trade to trade, R still works, as long as you record the actual risk on each trade at the moment of entry. That recorded number is what the check below uses.
- PlannedWhat the plan says this trade should risk
In money or as a share of the account.
- ActualEntry, original stop and size, not where the trade ended
A stop moved after entry counts as a break.
- RatioActual divided by planned
One is on plan. Look at the spread, not only the average.
The check: planned against actual
Take your last thirty to fifty trades. If you have fewer, use what you have and note it. For each one, you need three things.
- Planned risk. What your plan said this trade should risk, in money or as a percentage.
- Actual risk. What the position and the initial stop actually put at risk. Compute it from the entry, the original stop and the size, not from where the trade ended.
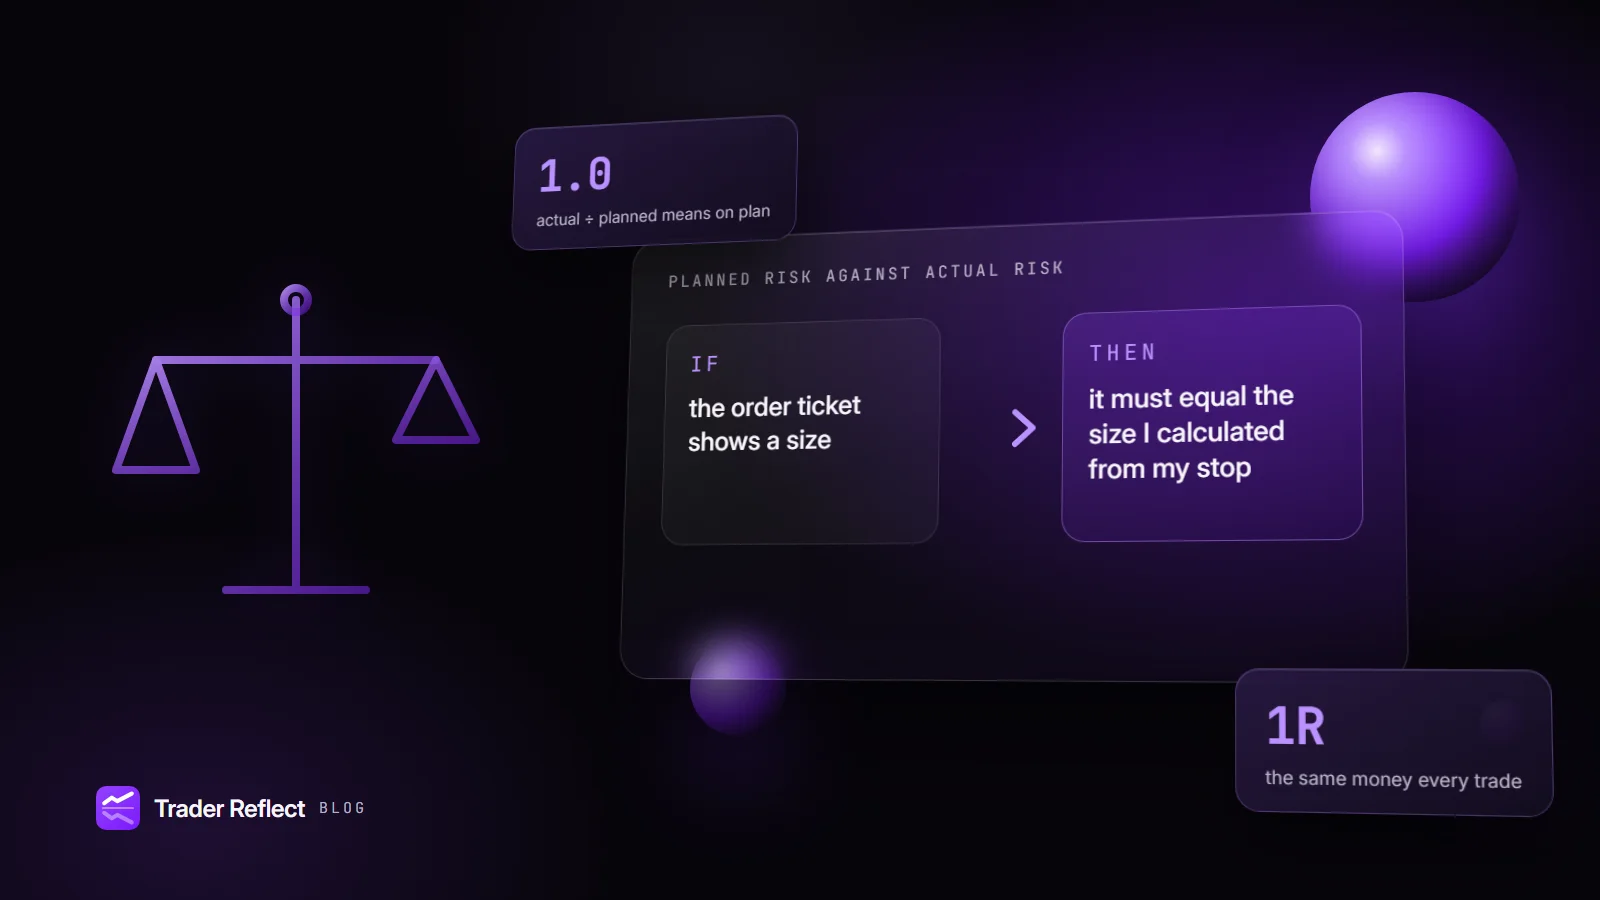
- The difference. Actual divided by planned. A value of 1.0 is on plan; 1.5 means you risked half as much again.
Now look at the distribution of that ratio, not just the average. Four patterns are common.
- Tight around one. Most trades are within a few percent of plan. Your sizing is working, and the question moves on to whether the plan itself is right.
- Drift upward over time. The ratio creeps above one after a good run. This is the sizing habit covered in the post on sizing up after a winning streak.
- Scattered. The ratio swings from well below one to well above it with no obvious reason. Sizing is done by feel. A simple calculator or a pre-filled template removes the guesswork.
- Spikes after losses. Larger size shortly after a loss is the signature of the urge to recover, and it deserves a separate look; see revenge trading in your own record.
Check the stop, not only the size
Actual risk depends on the stop. Two things distort it.
Stops moved after entry. If you widen a stop, the risk on the trade is no longer what you planned, even if the size did not change. Record the initial stop, and record any change as a break. A stop widened to avoid a loss is one of the more costly small habits, because it turns a planned one-R loss into something larger.
Stops placed for the wrong reason. A stop that sits where your account can tolerate it, rather than where the trade idea is wrong, forces a size that does not match the setup. The sister post on invalidation explains placing the stop where the idea stops being valid, and then letting the size follow.
What the check cannot tell you
Planned against actual risk tells you whether you follow your rule. It does not tell you whether the rule is a good one. A few cautions:
- A fixed percentage per trade says nothing about how many trades are open at once. Several correlated positions can add up to far more risk than any single entry shows.
- Slippage, gaps and fast markets can make the realised loss larger than the planned one even when you did everything right. Record those separately so they do not hide a real sizing habit.
- A small sample can mislead. Thirty trades can show a pattern, but one or two outliers can move an average a long way. Look at the ratio on each trade, not only the mean, and note how many trades each group has. The entry on sample size is a useful reminder.
Turning the finding into a rule
If you find a gap, resist the urge to promise to try harder. Write an if-then rule that removes the decision.
- If I am about to enter, then I compute the size from the stop distance and my planned risk before I open the order ticket.
- If the position size on the screen differs from the calculated size, then I do not send the order.
- If I have closed two winners in a row, then the next trade risks exactly the planned amount.
- If a trade closes at a loss, then the next trade's size is the planned size or smaller.
The post on if-then plans explains why a rule of this shape works better than an intention. Pick one, apply it for a few weeks, and run the check again on the new trades.
A simple record to keep
For each trade, store: the date, the instrument, the planned risk, the actual risk at the initial stop, the result in R, whether the plan was followed, and a one-word feeling. That is enough to repeat this check in ten minutes whenever you want to. The trading journal entry and the post on how to keep a trading journal that improves your results cover the rest.
Where Trader Reflect fits
If you keep your trades in the Money Circle journal, Trader Reflect looks for sizing habits in your own record, such as larger size after wins and after losses, and puts the number of trades behind each finding next to it. It reads what you recorded; it does not place orders or connect to your broker. You can open Trader Reflect from your Money Circle Journal and see what membership includes.
Educational content, not financial advice. Trading involves risk of loss.